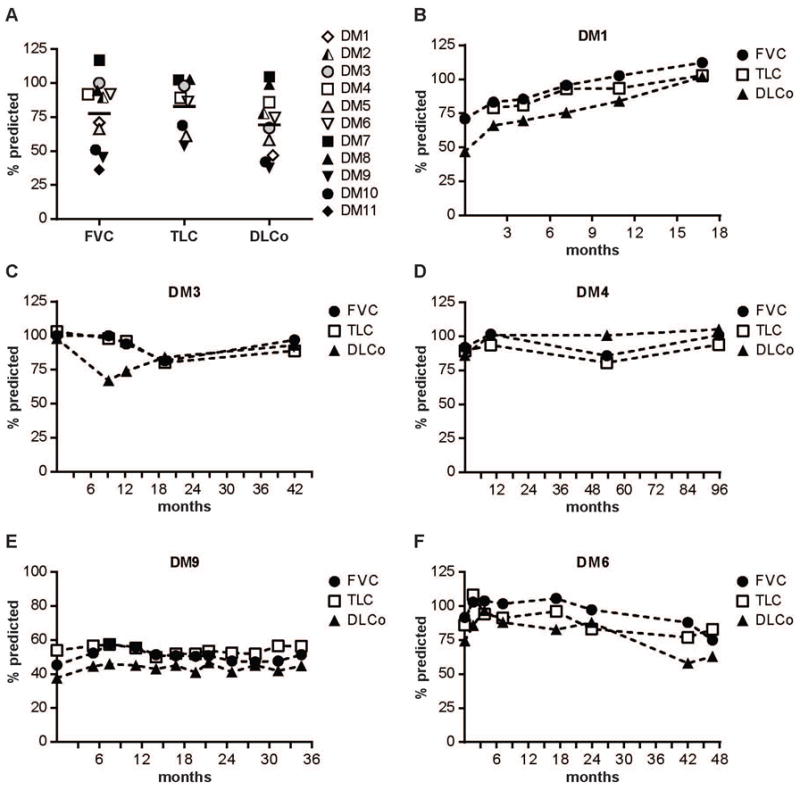
Figure 2. Pulmonary function testing in the anti-MDA5 positive cohort.

(A) Results of initial PFTs (where available) performed at or prior to the first clinic visit for all 11 anti-MDA5-positive patients. FVC, TLC and DLCo for each individual are shown as % predicted. The median value for each test is shown by the thick black bar. (B–F) Longitudinal PFTs for 5 anti-MDA5-positive patients demonstrating (B) lung function improvement; (C, D) a stable pattern within the normal range; (E) a stable pattern in the moderate to severely reduced range; and (F) declining lung function. The X-axis represents months of follow-up.
