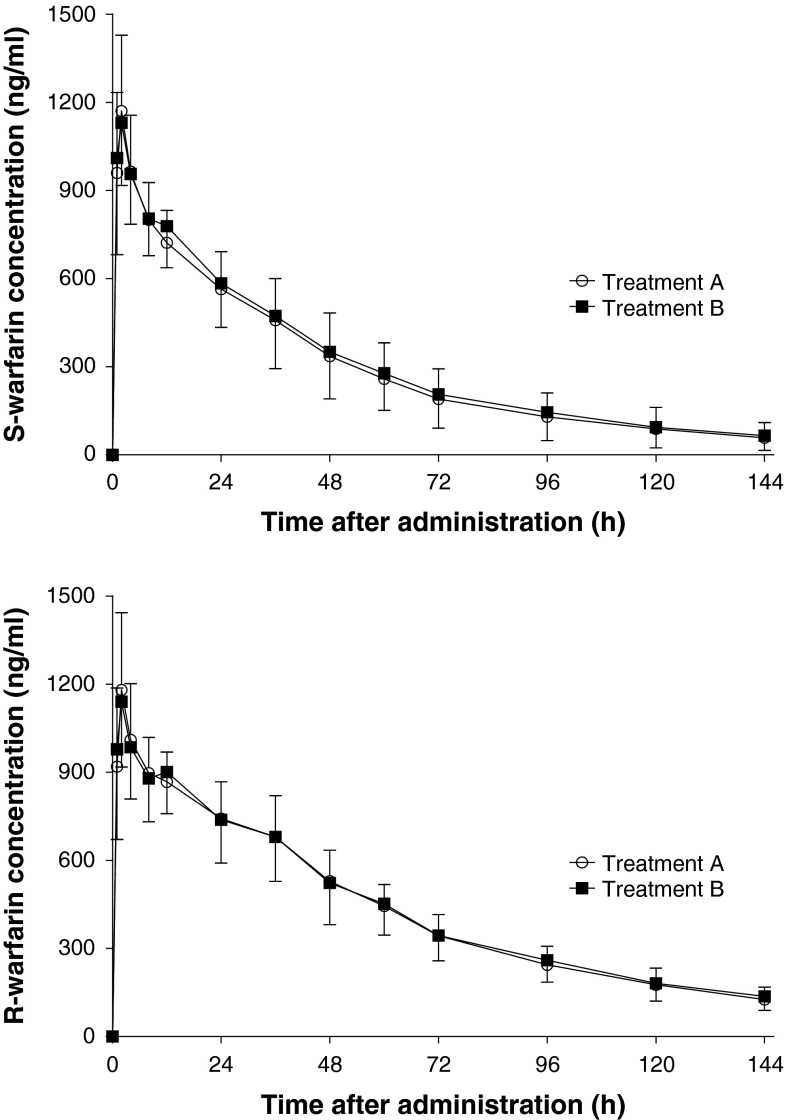
Fig. 1.
Arithmetic mean (and standard deviation) plasma concentration–time profile of S-warfarin (top panel) and R-warfarin (bottom panel) after administration of a single dose of 25 mg warfarin alone (treatment B) and in the presence of almorexant 200 mg once daily for 10 days with a single dose of 25 mg warfarin on day 5 (treatment A) to healthy male subjects (n = 13)

