
Figure 1.
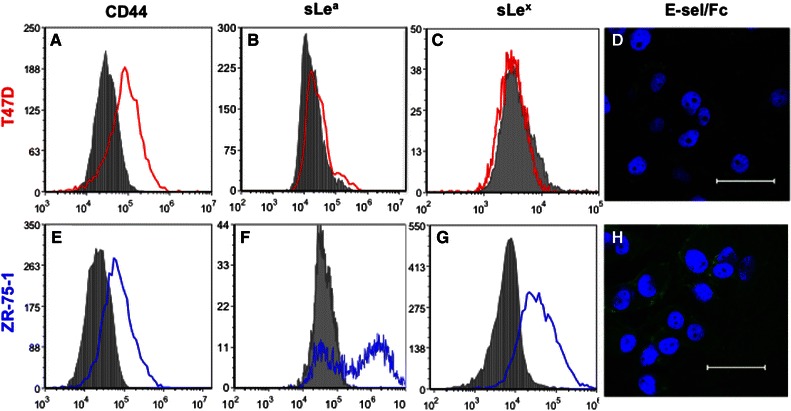
Flow cytometry histogram plots of T47D (in red) and ZR-75-1 (in blue) cells labeled with anti-CD44 mAb (a, e), anti-sLea mAb (b, f), and anti-sLex (clone CSLEX, c, g), respectively. Isotype controls are represented by solid gray peaks in each plot. (d, h) Confocal microscopy images of T47D and ZR-75-1 cells labeled with pre-conjugated recombinant human E-selectin/Fc (shown in green) and DAPI nucleic acid stain (shown in blue), respectively. Scale bar: 50 μm