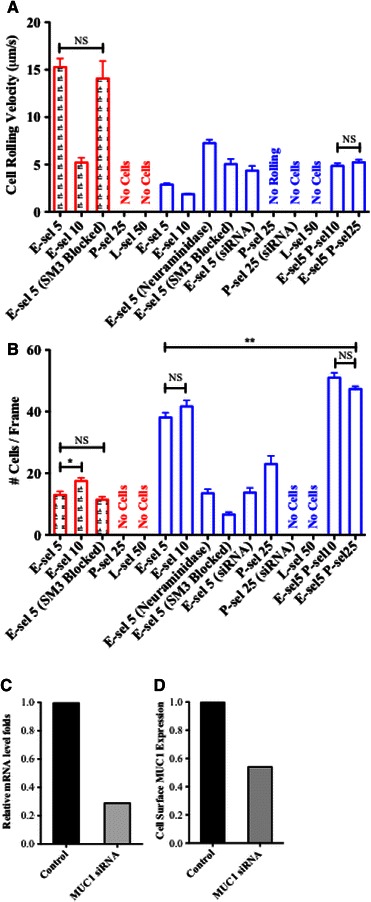
Figure 3.

Adhesion phenotype of T47D (in red) and ZR-75-1 (in blue) cells represented by their rolling velocity on E-selectin coated surface (a) and average number of cells observed on the surface (b). E-sel, P-sel, and L-sel indicate the surface proteins E-selectin, P-selectin, and L-selectin, respectively. Numbers following the surface protein abbreviations denote the surface protein concentration in μg/mL, for example “E-sel5” signifies that the surface protein E-selectin at a concentration of 5 μg/mL was utilized. Combined surfaces of E- and P-selectin were utilized with constant E-selectin concentrations (5 μg/mL) and varying P-selectin concentrations (10 and 25 μg/mL) and are denoted as “E-sel5 P-sel10” and “E-sel5 P-sel25,” respectively. Text in parentheses following the surface protein indicators denote specific treatments of either ZR-75-1 or T47D cells where (SM3 Blocked) and (Neuraminidase) indicates that cells were incubated with either anti-SM3 neutralizing antibody or neuraminidase, respectively. (siRNA) indicates that cells were transfected with MUC1 siRNA. Absence of parentheses indicates that no such treatments were performed. Student’s t test was performed for all results compared to E-sel5 within each cell line. Combined surfaces E-sel5 P-sel10 and E-sel5 P-sel25 for the ZR-75-1 cell line were also paired. All significances are p < 0.001, unless otherwise indicated by **p < 0.01, *p < 0.05, or NS (not significant). (c) Quantification of MUC1 mRNA level knockdown efficiency via qPCR. (d) Quantification of cell surface MUC1 protein level knockdown efficiency via flow cytometry (mean fluorescence intensity index was plotted)
