
Figure 6.
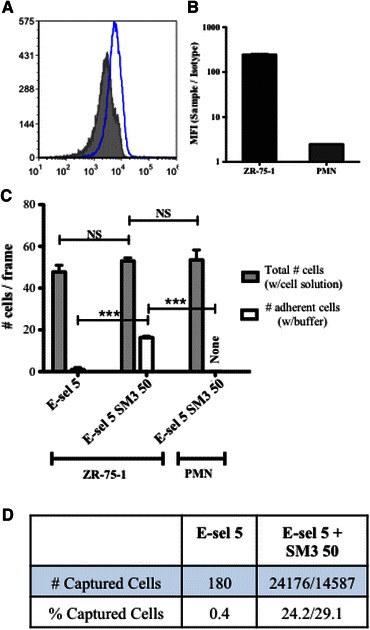
(a) Flow cytometry histogram plot of isolated PMNs labeled with anti-uMUC1 mAb (clone SM3, in blue) and isotype control (in gray). (b) Mean fluorescence intensity quantification of uMUC1 expression of ZR-75-1 cells (in black) and PMNs (in gray). (c) Average total number of ZR-75-1 cells (left and middle bar sets) and PMNs (right bar set) observed on surfaces coated with E-selectin at a concentration of 5 μg/mL (E-sel5) and the combination of E-selectin and SM3 at concentrations of 5 and 50 μg/mL, respectively (E-sel5 SM3 50). Columns in gray indicate the average number of cells (either ZR-75-1 or PMNs) while perfusing with cell solution and columns in white indicate the average number cells quantified after washing the surfaces with flow buffer for 5 min. Student’s t test was performed for both comparisons. ***p < 0.001; **p < 0.01; *p < 0.05. NS: not significant. (d) Numbers of captured ZR-75-1 cells from cancer cell spiked buffy coat on surfaces coated with E-selectin (5.0 μg/mL) and the combination of E-selectin (5.0 μg/mL) and SM3 (50 μg/mL). Two separate experiments were performed with 100,000 cells (24,176 captured) and 50,000 cells (14,587 captured), resulting in 24.2 and 29.1% yield, respectively