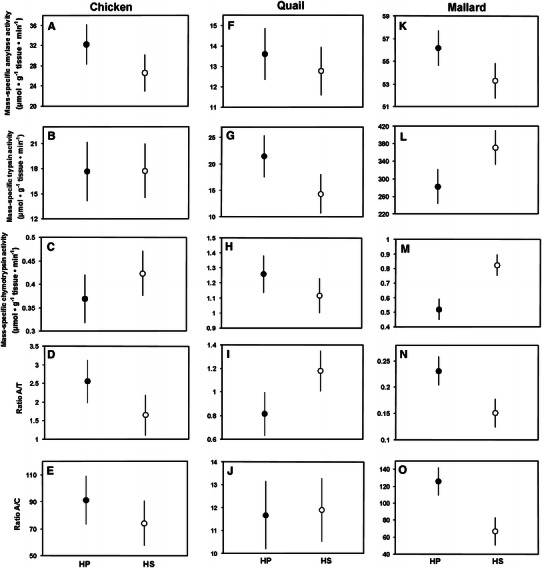
Fig. 4.

Mass-specific activities of pancreatic enzymes and ratios of amylase to trypsin (A/T) and amylase to chymotrypsin (A/C) activity in chickens (left column; trial 6), quails (central column; trial 7), and mallards (right column; trial 8). The filled circles indicate birds fed on the HP diet, and the open circles depict birds fed on the HS diet. Mean ± S.E.M. are shown. See Table 3 for significance of diet effect
