
Figure 10.
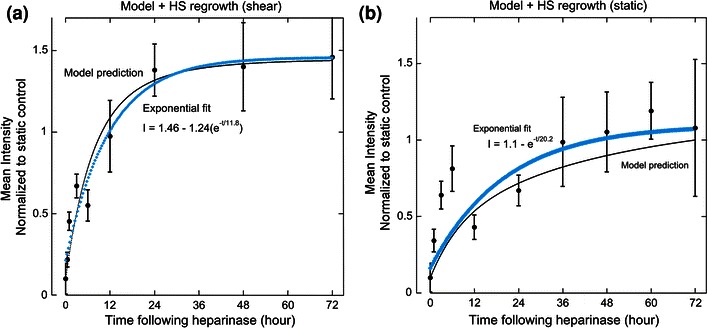
Model predictions closely follow experimental data. Model prediction (thin black line) is plotted with experimental data (filled circles) from heparan sulfate concentration following heparinase treatment for (a) static and (b) shear-conditioned HUVEC (15 dyn/cm2). Exponential fit to experimental data is represented by the thick blue line