
Figure 6.
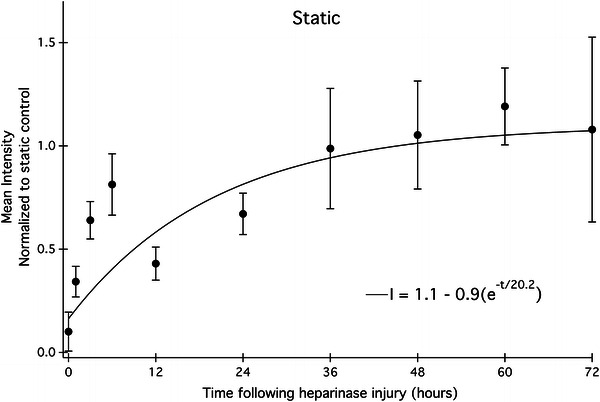
Heparan sulfate regrowth profiles under static conditions following heparinase treatment at time 0. Each point represents mean fluorescence intensity of HS from 4 to 9 images. The observed time constant, tau, is 20.2 ± 0.4 h
Official websites use .gov
A
.gov website belongs to an official
government organization in the United States.
Secure .gov websites use HTTPS
A lock (
) or https:// means you've safely
connected to the .gov website. Share sensitive
information only on official, secure websites.
Heparan sulfate regrowth profiles under static conditions following heparinase treatment at time 0. Each point represents mean fluorescence intensity of HS from 4 to 9 images. The observed time constant, tau, is 20.2 ± 0.4 h