
Figure 8.
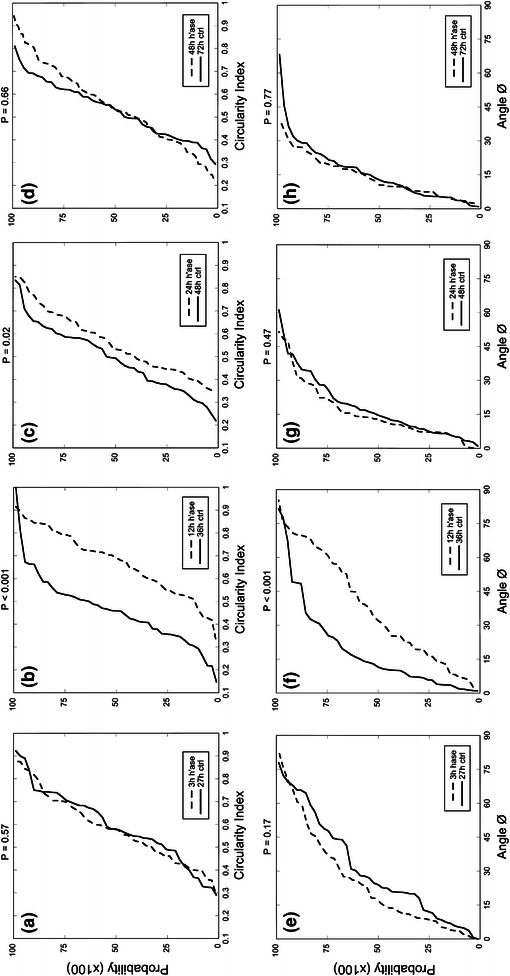
Cumulative probability distributions for heparinase-treated EC under laminar flow (15 dyn/cm2) measuring circularity index (a–d) and angle of alignment (e–h). Circularity indices for cells under laminar flow for (a) 3, (b) 12, (c) 24, and (d) 48 h following heparinase treatment and time-matched controls. Significant differences are shown after 12 and 24 h under laminar flow following enzymatic degradation. Angle of alignment data are given for cells under laminar flow for (e) 3, (f) 12, (g) 24, and (h) 48 h following heparinase treatment and time-matched controls. Significant differences are shown at 12 h following heparinase treatment. (N = 45 cells per group from 3 separate monolayers)