
FIGURE 2.
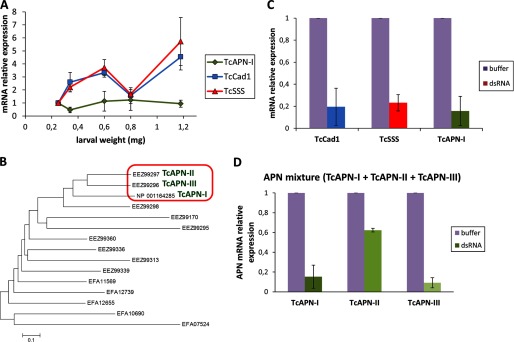
TcAPN-I, TcCad1, and TcSSS mRNA expression is reduced in response to injection of dsRNA. A, qRT-PCR analysis of TcAPN-I, TcCad1, and TcSSS mRNA expression levels in Tc larvae of different weight. RPS18 mRNA abundance was used to normalize gene expression. B, unrooted phylogenetic tree generated with Mega 5 (46) of 15 Tc aminopeptidases N and aminopeptidases-like amino acid sequences. The neighbor-joining method (47) for reconstructing the phylogenetic tree was used. The tree is drawn to scale, with branch lengths in the same units as those of the evolutionary distances used to infer the phylogenetic tree. The evolutionary distances were computed using the Poisson correction method (48) and are in the units of the number of amino acid substitutions per site. All positions containing gaps and missing data were eliminated. C, gene silencing in Tc larvae in response to injection of TcAPN-I or TcCad1 or TcSSS dsRNA. The relative amount of Tc gene transcripts estimated by qRT-PCR in buffer-injected control larvae and silenced larvae was compared, normalized to the expression of RPS18 gene. The statistical significance of the gene expression between the two samples was evaluated using Student's t test, and significant knockdown was observed (p < 0.05) for all genes. The error bars represent standard errors of the mean of two biological samples and three technical replicates each. D, gene silencing in Tc larvae in response to injection of a mixture of TcAPN-I and TcAPN-II and TcAPN-III dsRNA. The relative amount of each individual Tc gene transcript corresponding to TcAPN-I, TcAPN-II, or TcAPN-III estimated by qRT-PCR in buffer-injected control larvae, and silenced larvae was compared normalized to the expression of RPS18 gene. The statistical significance of the gene expression between the two samples was evaluated using Student's t test, and significant knockdown was observed (p < 0.05) for all genes. The error bars represent the standard error of the mean of two biological samples and three technical replicates each.