FIGURE 2.
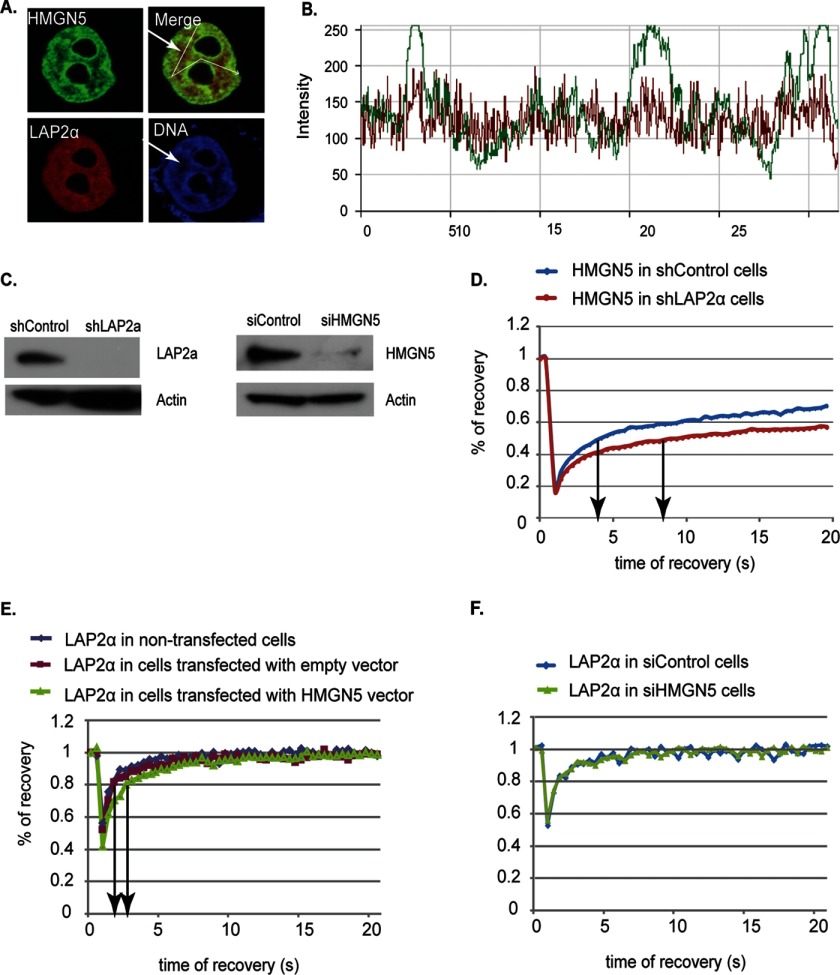
Mobility of HMGN5 and LAP2α in wild type and knock-out cells. A, localization of HMGN5 and LAP2α in HeLa cells. The arrow points to euchromatic regions. B, localization profiles along the paths depicted by the lines drawn in A. C, Western analysis reveals efficient down-regulation of either HMGN5 or LAPα levels in HeLa cells. shControl, control shRNA; shLAP2a, LAPα shRNA. D–F, FRAP recovery curves. The protein analyzed and the types of cells used are indicated on the top of each panel.

