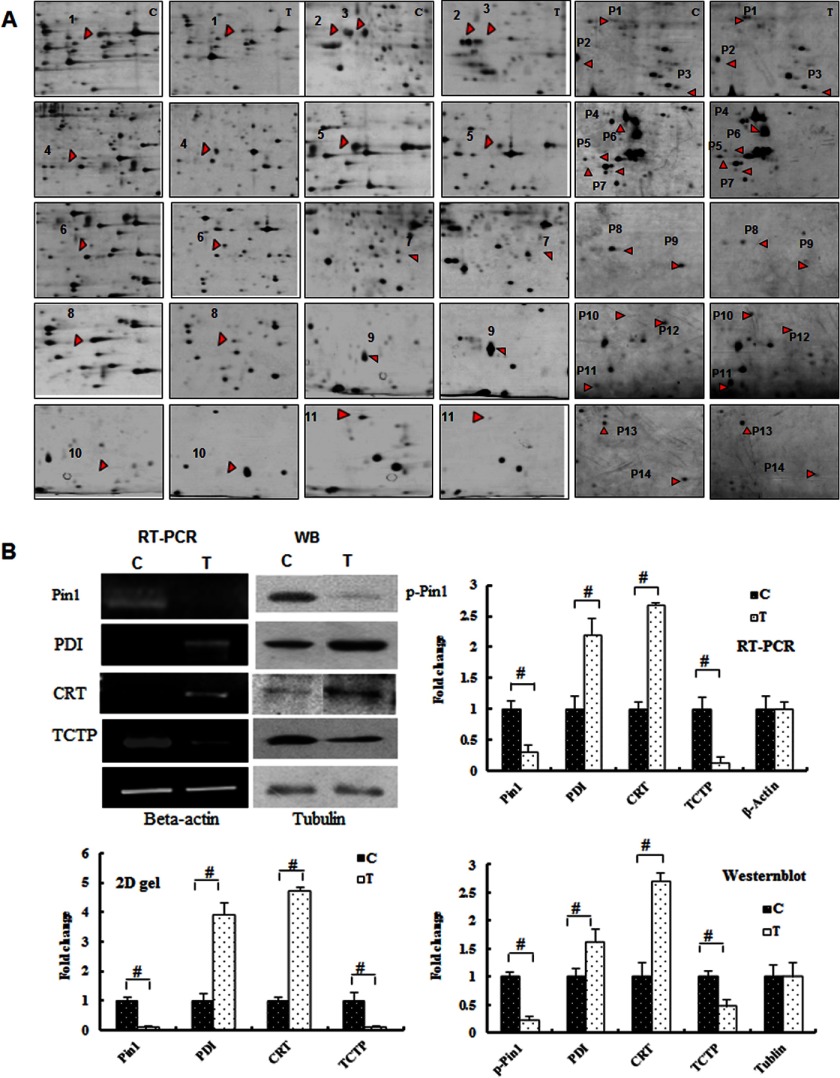
FIGURE 3.
Identification of differentially expressed proteins by proteomic analysis. A, the protein spots are indicated with arrows and numbers corresponding to the proteins listed in supplemental Table 1. B, RT-PCR and Western blot (WB) analyses of the proteins, as indicated, and quantification of the -fold changes observed in the two-dimensional gel, RT-PCR, and Western blot analyses of these proteins (#, p < 0.01). Error bars, S.D.

