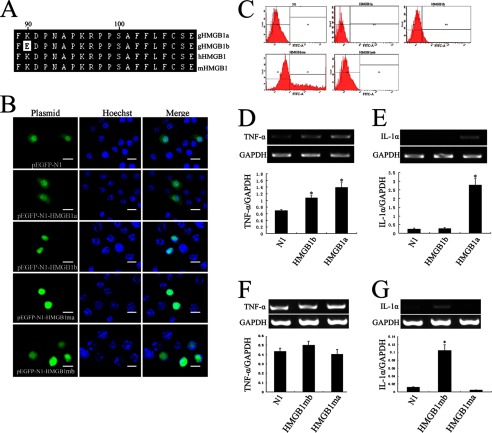
FIGURE 4.
Production of inflammatory cytokines in macrophage RAW 264.7 cells transfected with pEGFP-gHMGB1a, pEGFP-gHMGB1b, and mutation plasmids. A, alignment of first 20 amino acids from B-box domain of gHMGB1 paralogs, human and mouse HMGB1, showing an amino acid difference in gHMGB1b. B, overexpression of pEGFP-N1, pEGFP-gHMGB1a, pEGFP-gHMGB1b, mutation plasmids (Lys ↔ Glu) pEGFP-gHMGB1ma and pEGFP-gHMGB1mb in RAW 264.7 cells for 48 h. C, transfected cells were selected by flow cytometry. D and E, transcriptional analysis of TNF-α and IL-1α in macrophages following transfected with pEGFP-gHMGB1a and pEGFP-gHMGB1b. F and G, transcriptional analysis of TNF-α and IL-1α in macrophages following transfected with pEGFP-gHMGB1ma and pEGFP-gHMGB1mb. Control means cells transfected by pEGFP-N1. Quantities were normalized to endogenous GAPDH expression. Error bars in D–G represent the standard deviation (*, p < 0.01). Scale bars, 30 μm.

