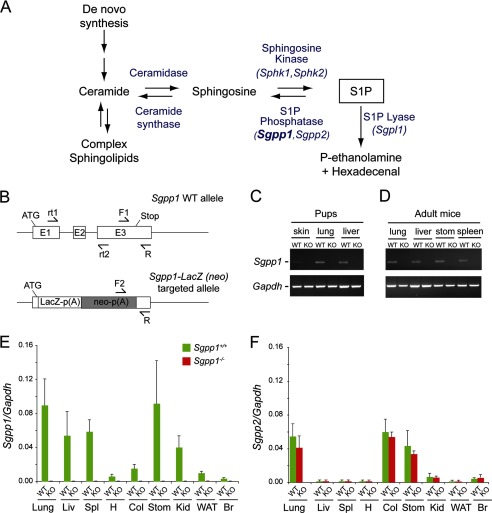
FIGURE 1.
Generation of Sgpp1 knock-out mouse line by Sgpp1 gene disruption. A, intracellular metabolic pathway of S1P. B, schematic representation of the Sgpp1 gene targeting strategy. The structure of the mouse Sgpp1 locus is shown at the top, and the structure of the Sgpp1 targeted allele is shown at the bottom. Arrows F1, F2, and R represent the primers used for genotyping; arrows rt1 and rt2 represent the primers used in semiquantitative RT-PCR. C and D, mRNA expression for Sgpp1 (top gels) and Gapdh (bottom gels) determined by semiquantitative RT-PCR of various tissues from Sgpp1+/+ (WT) and Sgpp1−/− (KO) 2-day-old (C) and adult (D) mice. E and F, mRNA expression for Sgpp1 (E) and Sgpp2 (F) determined by RT-qPCR of various tissues from Sgpp1+/+ and Sgpp1−/− adult mice. LIv, liver; Spl, spleen; H, heart; Col, colon; Stom, stomach; Kid, kidney; WAT, white adipose tissue; Br, brain. The relative level of Gapdh mRNA expression in each sample was set to 1. Bars represent mean values ± S.D. Student's t test, n = 4.

