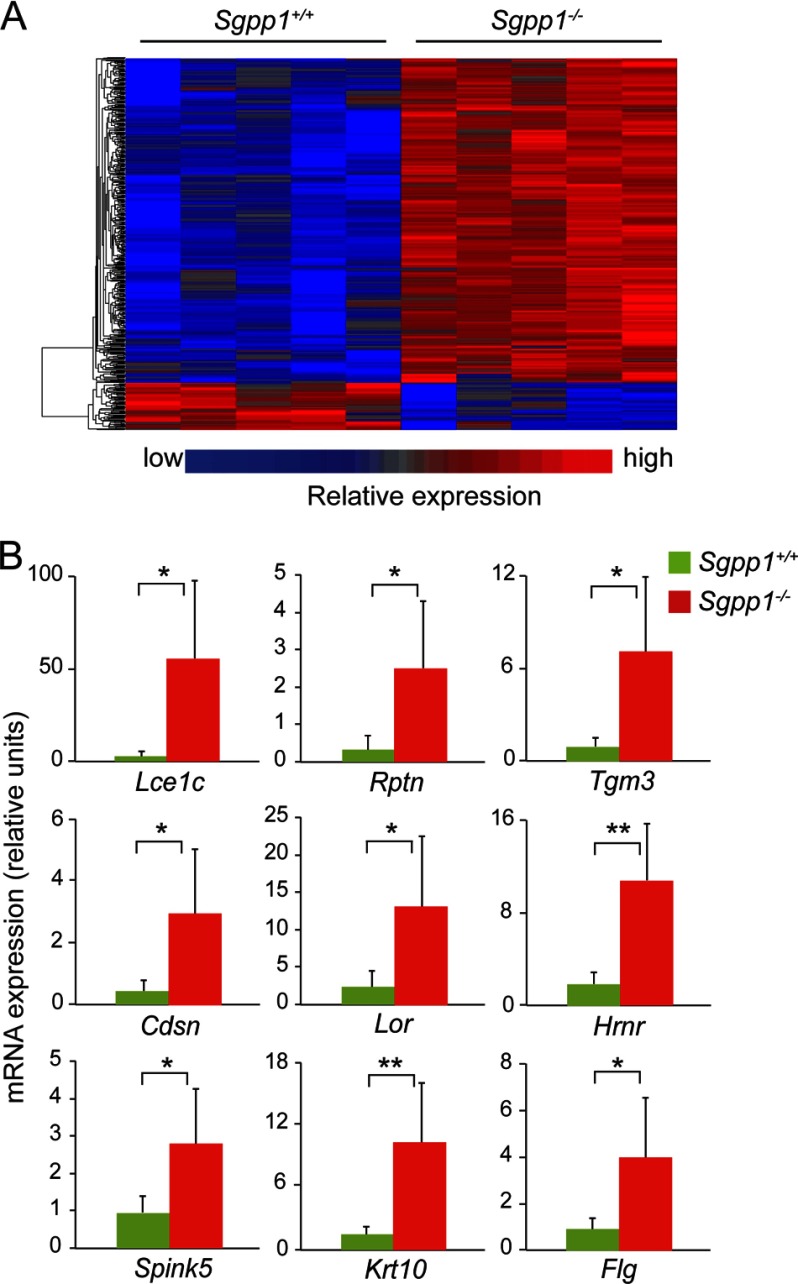
FIGURE 8.
Gene expression profile of keratinocytes in vitro. A, microarray gene expression analysis was performed with RNA from five Sgpp1+/+ and five Sgpp1−/− keratinocyte cultures, isolated from individual mice, grown in low Ca2+ media for 3–4 days. The heat map shows the raw signal values of genes that are significantly different between Sgpp1+/+ and Sgpp1−/− groups, using a cutoff of p < 0.05 and a fold change of greater than 2. B, expression levels of nine genes among the top 50 determined by microarray analysis to be overexpressed in Sgpp1−/− keratinocytes were validated by RT-qPCR. Results are expressed as mean value ± S.D. n = 6 for both genotypes. Student's t test; *, p < 0.05; **, p < 0.01.

