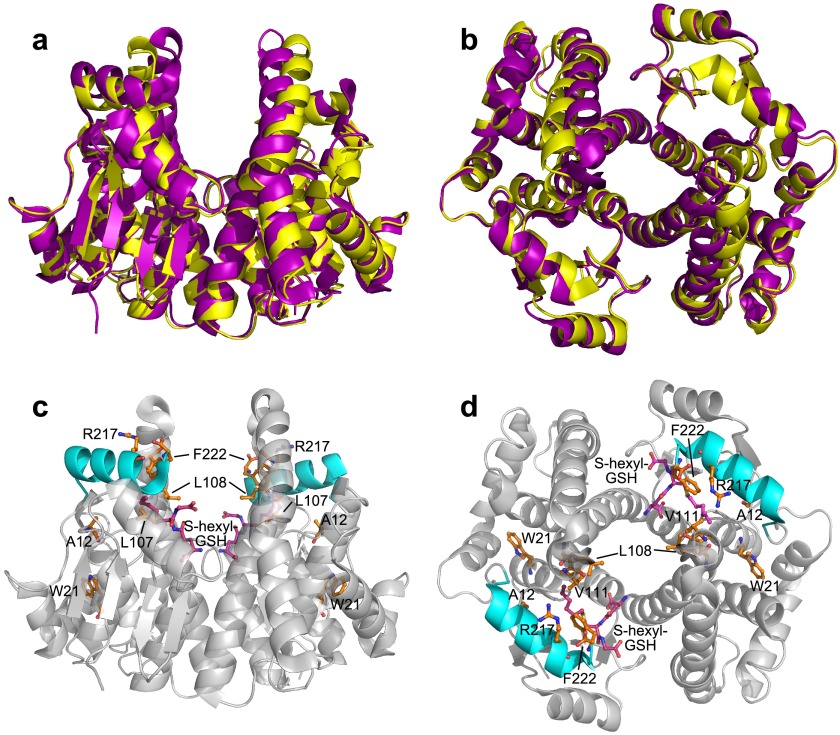
FIGURE 2.
GSTA1–1 and A4–4 dimers. a and b, ribbon diagram overlay of apo-GSTA1–1 (purple) and apo-GSTA4–4 (yellow). c and d, ribbon diagram of GSTA1–1 with S-hexyl GSH (magenta) bound. The C terminus, residues 208–222, is shown in cyan, and sites of mutation are illustrated in orange. Views are with the 2-fold axis of symmetry vertical within the plane of the page (a and c), or perpendicular to the page (b and d). apo-GSTA1–1, Protein Data Bank code 1K3O; GSTA1–1 with S-hexyl Protein Data Bank code; 1K3Y, GSTA4–4 Protein Data Bank code, 1GUM.

