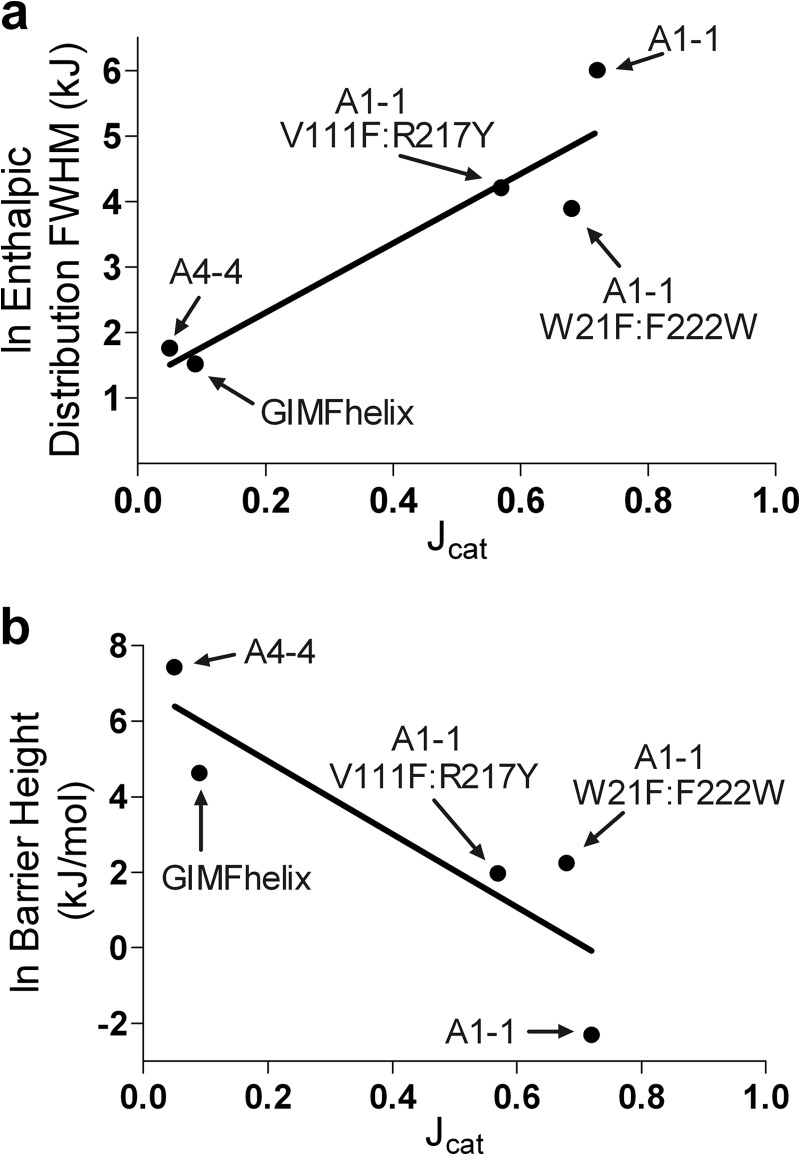
FIGURE 5.
Correlations of promiscuity and conformational landscape. a, natural logarithm transforms of the full-width at half-maximum (FWHM) values from the probability densities at 300 K recovered from variable-barrier analysis (Fig. 3, right panels) of the low temperature transitions are plotted versus promiscuity (●), along with the linear best fit (black), R2 = 0.8619. b, natural logarithm transforms of free energy barrier heights (Fig. 3, center panels) versus promiscuity (●), with the linear best fit (black), R2 = 0.7666. A barrier height of 0.1 kJ/mol was substituted for the recovered barrier height of −30 kJ/mol for GSTA1–1 wild-type to allow for the ln transform.

