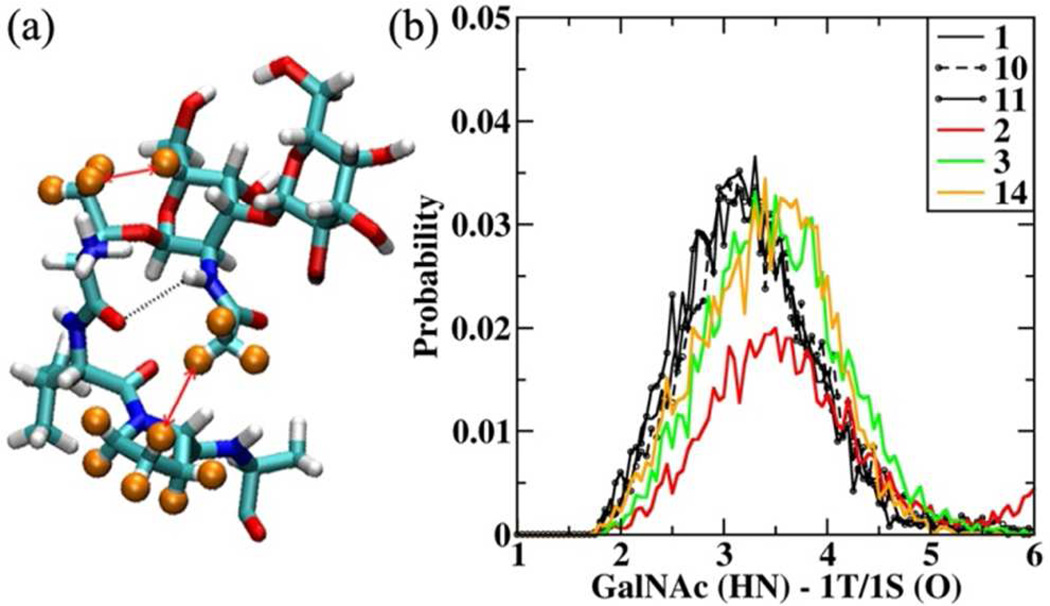
Figure 1.
(a) Representative structure of 1 from HREX simulations showing the carbohydrate unit and the first three amino acids (TVP). The H-bond is shown in black dotted line. The hydrogen’s involved in the ROE signals are identified using orange spheres and the interaction is highlighted using red arrows. (b) GalNAc (HN) − 1T/1S (O) H-bond distribution for 1, 10, 11, 2, 3, 14. Distances presented in Å.

