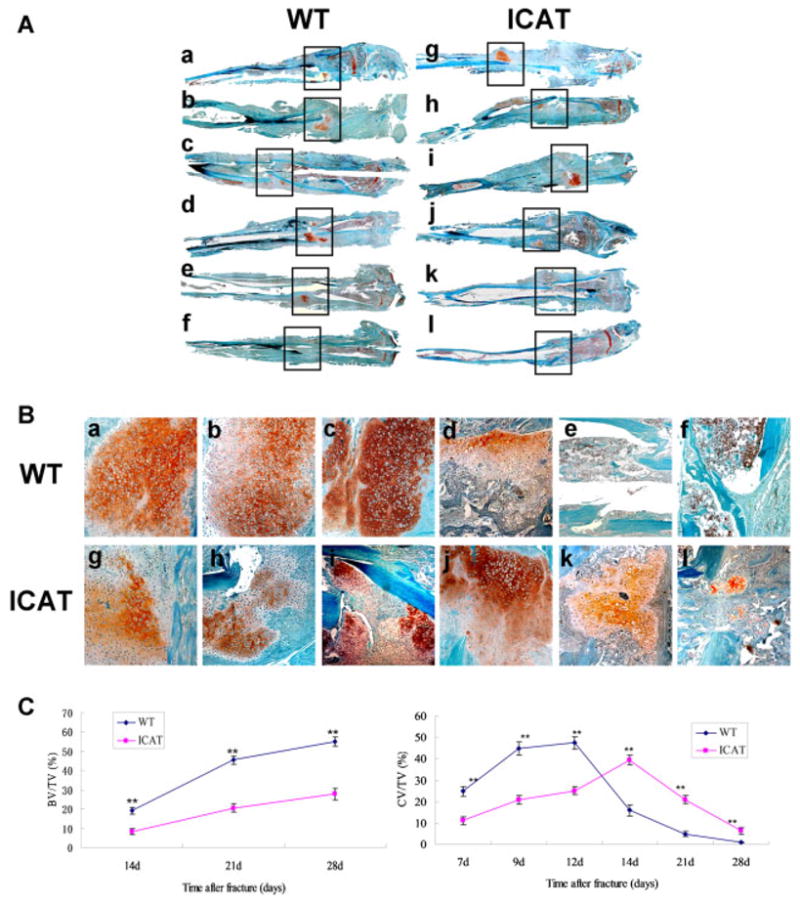
Figure 2.

Histopathological observations of bone fracture healing at 7, 9, 12, 14, 21, and 28 days after surgery in WT (a–f) and Col2a1-ICAT (g–i) mice. The orange color indicates the cartilage calluses in the fracture sites stained with Safranin O/fast green. (A) Images of fractured tibias in WT and Col2a1-ICAT mice. The black frames demonstrate the fracture sites (original magnification ×50). (B) Enlarged view of the images shown in A (original magnification ×100). (C) Histomorphometry revealed the cartilage volume/total callus volume (CV/TV) and the bone volume/total callus volume (BV/TV) at fracture sites in WT and Col2a-ICAT mice. All the measurements were made at five different sites for each section (**p < 0.01). [Color figure can be seen in the online version of this article, available at http://wileyonlinelibrary.com/journal/jor]
