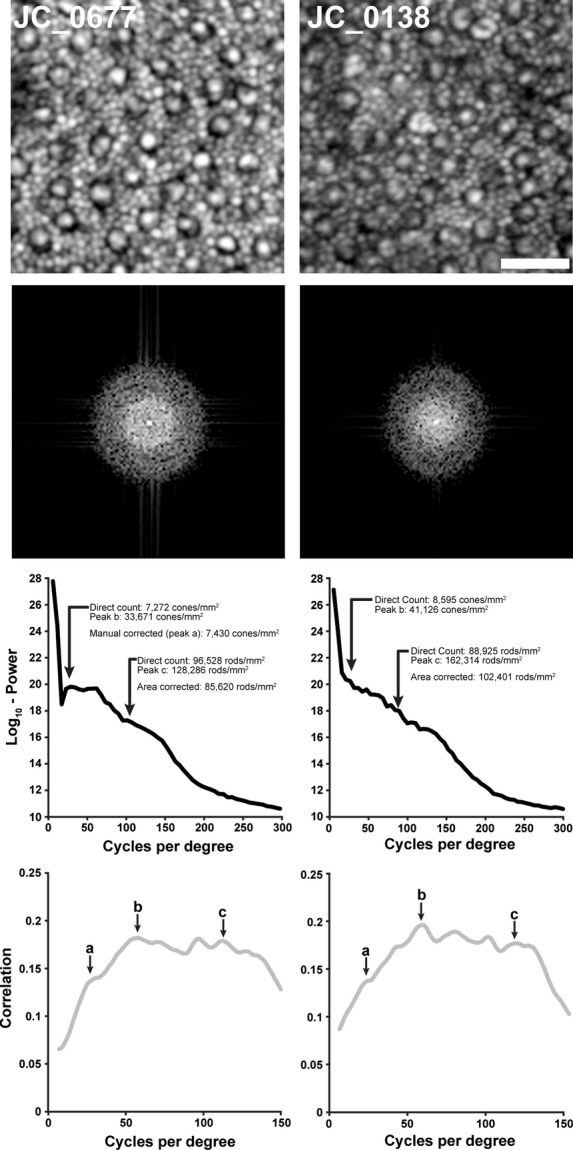
Figure 4.

Estimating density in perifoveal images containing rod and cone photoreceptors. Shown are two retinal images (log10-display) from about 10 degrees temporal to fixation (scale bar is 20 μm), along with the 2D log10-power spectrum for each image. In these images, the automated power-spectrum derived density estimates overestimate the direct count density values for both the cone and rod mosaics. The presumed cone peak in the correlation plot (peak b) actually corresponds to the size of the cones themselves, not their modal spacing. The subtle peak on the ascending limb of the correlation plot (peak a) corresponds to cone spacing, using this spacing to estimate density yields values in better agreement with the direct count estimates. Using this estimate of cone density together with an estimate of the area of each cone from peak b and the modal spacing of the rod mosaic (peak c), it is possible to estimate the number of rods displaced by the cone mosaic and derive a corrected estimate of rod density. This approach yields rod density values in better agreement with the direct count values. Note that the x-axes of the lower plots are different scales.
