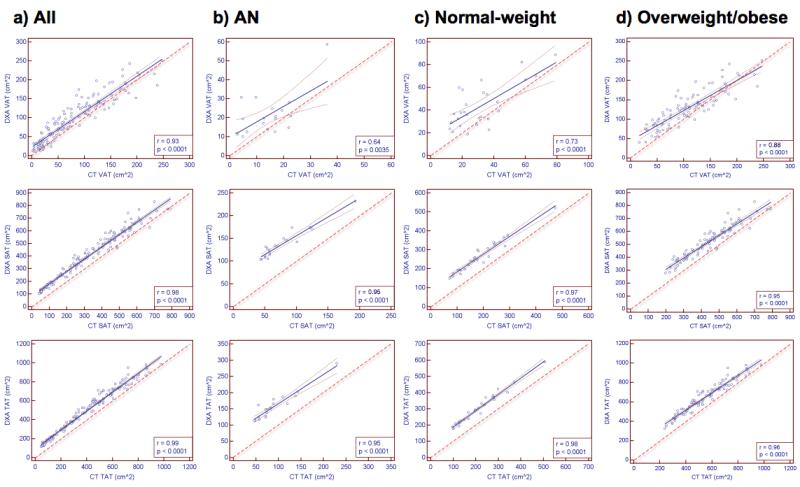
Figure 1.
Correlation analysis between CT and DXA measures of visceral adipose tissue (VAT), subcutaneous adipose tissue (SAT), and total adipose tissue (TAT) in all subjects (a), anorexia nervosa (AN) subjects (b), normal weight subjects (c), and overweight/obese subjects (d). Correlations were strongest in the normal weight and overweight/obese groups. Thin dashed lines indicate 95% confidence interval. Thick dashed line indicates line of identity.

