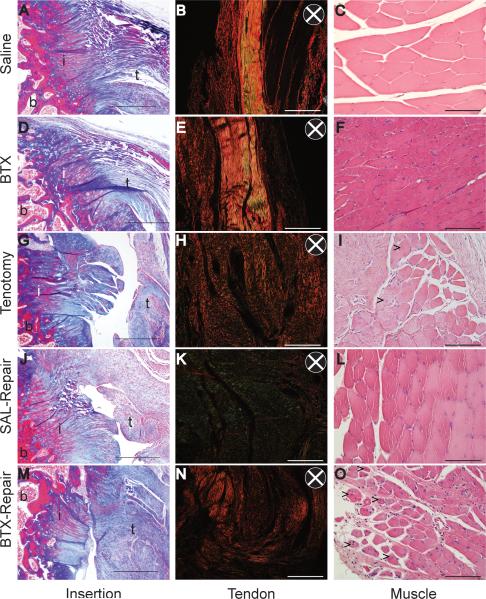
Figure 6.
Representative histological sections of the tendon-to-bone insertion (left column, Masson's trichrome), tendon organization (middle column, picrosirius red under polarized light), and muscle morphology (right column, hematoxylin and eosin) of Saline (A-C), BTX (D-F), Tenotomy (G-I), SAL-Repair (J-L), and BTX-Repair (M-O) at 21 days post-injury. Arrows in I and O indicate cell nuclei clustering in myocytes. B = bone, I = insertion, T = tendon. Scale bar = 500μm (left column) and 100μm (middle and right columns). The direction of the polarizing filters is shown in the insets of B, E, H, K, and N.

