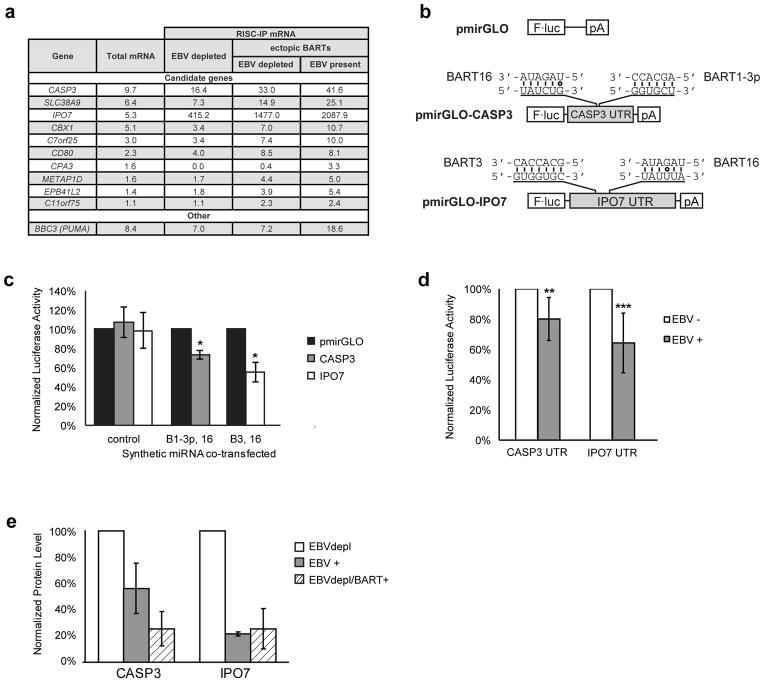
Figure 2. Identification of BART miRNA targets.
(a) RNA-seq was performed on total mRNA and RISC immunoprecipitations from S1-1 cells. The top 10 candidate genes (ranked by their expression level in the S1-1 cells) are listed with their detected expression values for each condition. As a control, the expression values of the BART5 target BBC3 (PUMA) are also listed. BART5 is inefficiently expressed from the BART retroviral vectors. (b) Reporter assays were conducted with constructs encoding the 3′-UTRs of CASP3 and IPO7 downstream of luciferase. The predicted target sites and corresponding miRNA seed sequences are shown. (c) 293 cells were transfected with luciferase vectors and mature synthetic miRNA, and the luciferase activity was normalized as described in the Materials and Methods. Data are the average of three independent experiments ± s.d. (*p<0.05, Wilcoxon rank sum test). (d) The vectors were introduced into EBV-positive or EBV-negative Oku-BL cells, and the normalized luciferase activity in the EBV-negative cells was set to 100%. Data are the average of six independent experiments ± s.d. (**p =0.037, ***p=0.006, Wilcoxon rank sum test). (e) Importin-7 and caspase-3 levels from cell lysates of S1-1 cells treated as in Figure 1 were measured by Western blot. Importin-7 and caspase-3 levels were normalized to alpha-tubulin levels, and then compared to the EBV depleted cells (cells transduced with empty vectors, dnEBNA1 turned on) whose normalized level was arbitrarily set to 100%. Data are the average of two independent experiments ± s.d. The blot images are given in Supplementary Figure 5.

