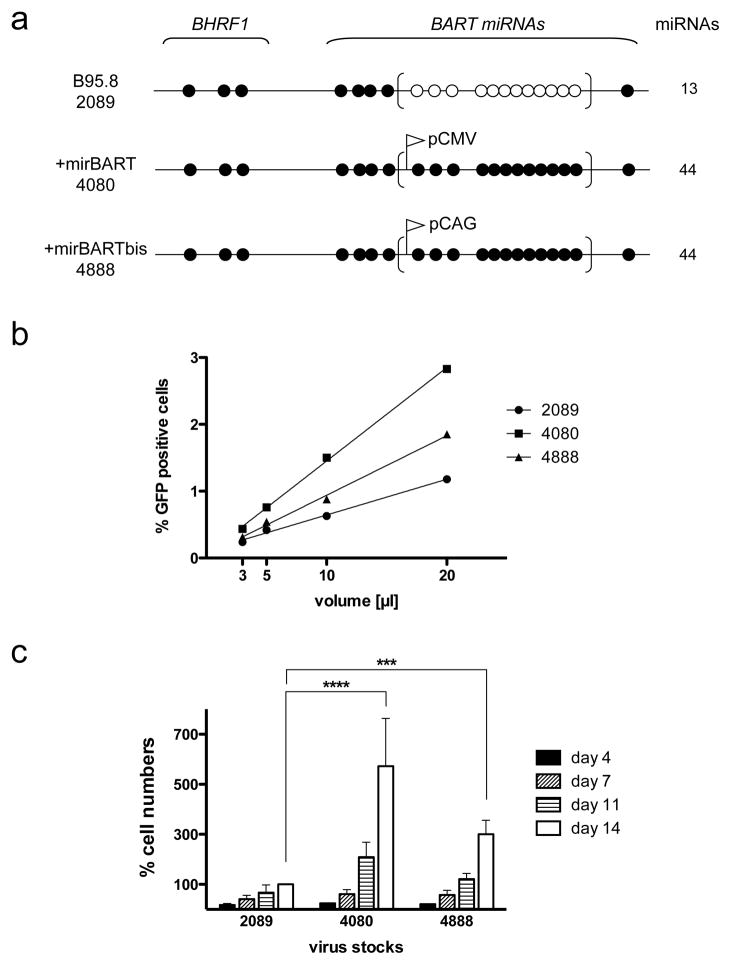
Figure 3. BART miRNAs promote the transformation of primary human B cells.
(A) A simplified diagram of the pre-miRNAs of the three recombinant viruses studied is shown. The upper diagram represents 2089, which is the recombinant version of the prototypic EBV strain B95-8. Closed circles represent encoded pre-miRNAs; open circles represent deleted pre-miRNAs. EBV field strains other than the reference strain B95.8 encode up to 25 pre-miRNAs, which result in four mature BHRF1 miRNAs and 40 BART miRNAs. Two reconstituted EBV mutants that ectopically express the full set of 40 BART miRNAs were assembled from sub-genomic fragments as described 9. To construct the mutant EBV +mirBART (4080), the BART miRNA locus was inserted into the BALF1 gene of EBV, where it is expressed under the control of the CMV immediate early promoter. To construct the mutant EBV +mirBARTbis (4888), the assembled BART miRNA locus was inserted into the prokaryotic plasmid backbone of the prototypic 2089 strain, where it is expressed from the composite CAG promoter 28.
(B) Titration of virus stocks. 1×10⁵ Raji cells were infected with different volumes of virus stocks as shown. Three days post infection, the percentage of GFP-positive Raji cells was determined on a FACS machine, calculated and plotted. The virus stocks 2089, 4080, and 4888 contained 7.1×10⁴±1×10⁴, 1.5×10⁵±4.6×10³, and 1×10⁵±9.3×10³ green Raji units [GRU]/ml, respectively. (C) Primary human B cells isolated from adenoids from five different donors were infected with the three virus stocks at a multiplicity of infection of 1×10⁻³, incubated for 18 hours, and seeded in fresh medium at a density of 1.5×10⁵ cells per ml. At the days indicated the cells were harvested and their proliferation analyzed by FACS. To determine the absolute number of cells counted, a volume standard was added prior to FACS analysis as described 9, 30. To correct for variations between donors’ B cells, the raw cell counts were normalized to those infected with 2089 at day 14 (whose value was arbitrarily set to 100%). The average of five different donors ± SD is shown. p-values (p<0.001 ***, p<0.0001 ****) for the time points are indicated (two way ANOVA linked to Bonferroni post-tests; www.graphpad.com, Prism vers. 5.0).

