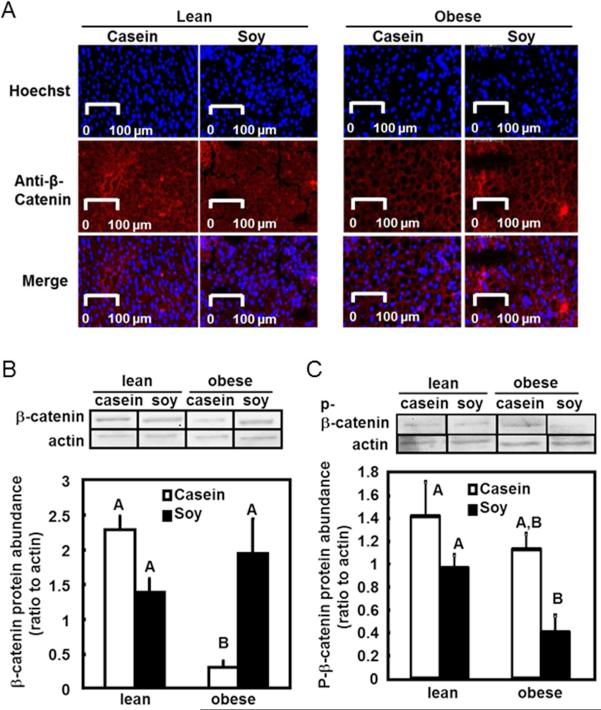
Figure 3. Protein abundance of β-catenin in liver.
A. Immunofluorescent staining of β-catenin. Protein content of β-catenin in liver was analyzed by immunofluorescent staining using an antibody against β-catenin protein and an Alexa Fluor 647-labeled secondary antibody (red, middle panel). Nuclei were counterstained with Hoechst 33342 fluorescent stain (blue, top panel). The two pictures were merged to show the cytoplasmic location of β-catenin staining (merge).
B. Hepatic β-catenin protein level in whole cell extract was quantified using western blot analysis. The upper panel shows representative blots from western blot analysis using antibodies against β-catenin and the loading control actin. The amount β-catenin protein was normalized to actin as the relative protein abundance. The relative β-catenin protein was presented as the mean ± SEM, n= 4. Individual bars with different letters differ (P<0.05).
C. Phosphorylated β-catenin (p-β-catenin) protein level was measured using western blot and the quantifications are presented as described in Figure 3B.

