Fig. 5.
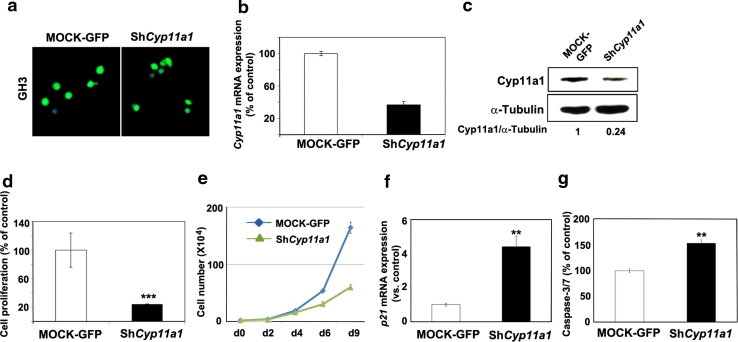
Effect of Cyp11a1 on tumor cell proliferation. a Infection of GH3 cells with lentiviral vectors expressing shCyp11a1-GFP or GFP only (MOCK). b GH3 cells were infected with the lentiviral vectors as in “a” and the level of Cyp11a1 was analyzed by qRT-PCR 72 h later. c In samples parallel to “b”, proteins were extracted, and Western blotting was performed to monitor Cyp11a1 expression. The ratios of the band intensities for P450scc versus α-tubulin, normalized against the ratio in the MOCK control (ratio = 1), is indicated. d In samples parallel to “b”, cell proliferation was assessed 72 h after infection using the WST-1 assay. Data were analyzed independently with six replicates each and were expressed as the mean ± SEM. e Growth curve of GH3 cells infected with lentiviral vectors expressing shCyp11a1-GFP or GFP only (MOCK). Cells were trypsinized, stained with Trypan Blue and viable cells were counted. Values are the mean of 3 independent experiments ± SD. f In samples parallel to “d”, the expression of p21 was assessed by qRT-PCR as indicated in the legend of Fig. 1, and is reported relative to the expression level in mock-transfected cells arbitrarily set to 1. g In samples parallel to “d”, caspase 3/7 activity was measured to monitor apoptosis 72 h post-infection. Data were analyzed independently with six replicates each and were expressed as the mean ± SEM. **P < 0.01, ***P < 0.001, versus MOCK

