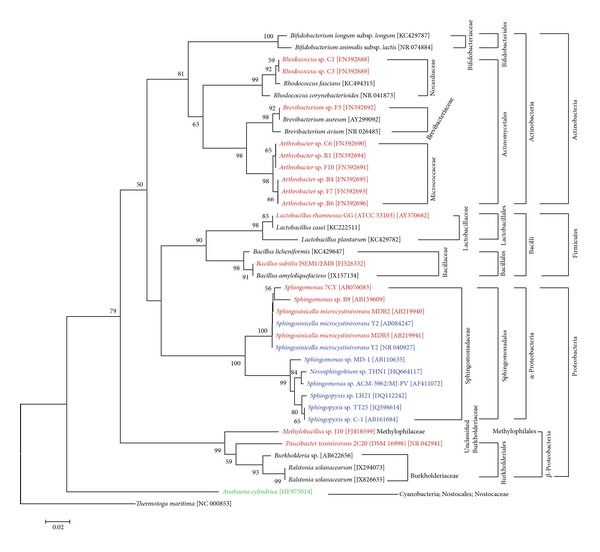
Figure 2.

Phylogenetic tree of the 16S rRNA gene sequences of isolates that either carry the mlrA gene (in green) or degrade MC (in red) or both (in blue), based on the neighbour-joining method and a Jukes-Cantor distance matrix. One thousand bootstrap analyses were conducted, and percentages greater than 50% are indicated at nodes. The numbers in brackets are GenBank accession numbers. Thermotoga maritima was used as an outgroup. Scale bar represents 2% estimated distance.
