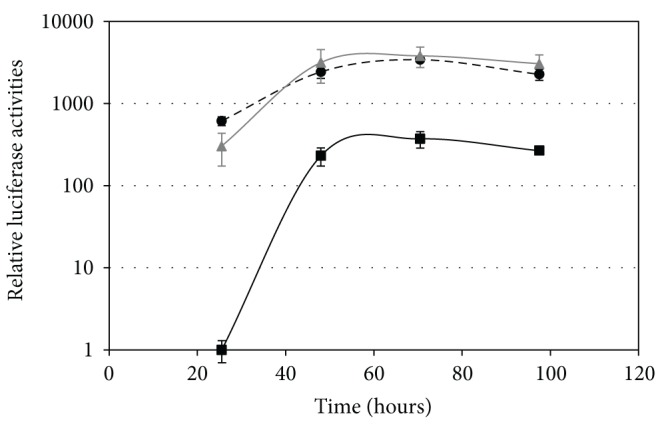
Figure 3.

Relative luciferase activities under repressed growth conditions and during the glucose-depletion phase for the wild-type P. pastoris P AOX1 promoter (black squares) and variants LC-2 (grey triangles) and LU-2 (black circles, dashed line) in plasmid pPPE35 expressed in P. pastoris GS115. Enzyme activities are shown in logarithmic scale. The values are the average of two biological replicas, and the error bars show the standard deviations. The activities are relative to the wild-type, for which the value at the first time point is arbitrarily set to 1.
