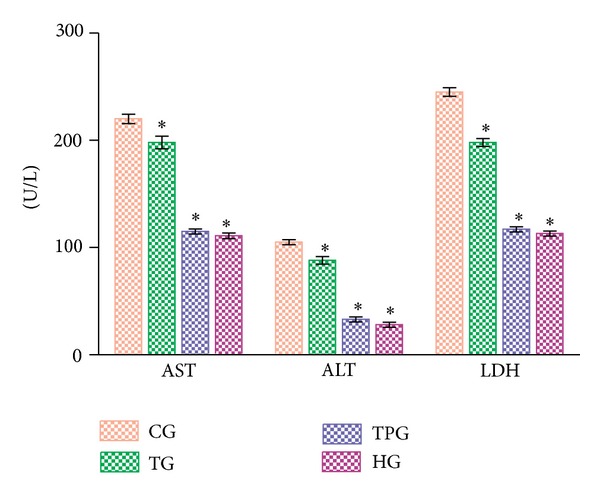
Figure 1.

Comparison of groups in terms of serum AST, ALT, and LDH levels.*P < 0.0001, group data were compared against the CG group. Notes: differences among groups were obtained using ANOVA post hoc with the least significant difference option. Each group contained six animals. AST, ALT, and LDH levels are defined in U/L. Bars are mean ± standard deviation. CG, control group; TG, thiamine 20 mg/kg + cisplatin group; TPG, TPP 20 mg/kg + cisplatin group; CG, control group.
