Figure 2.

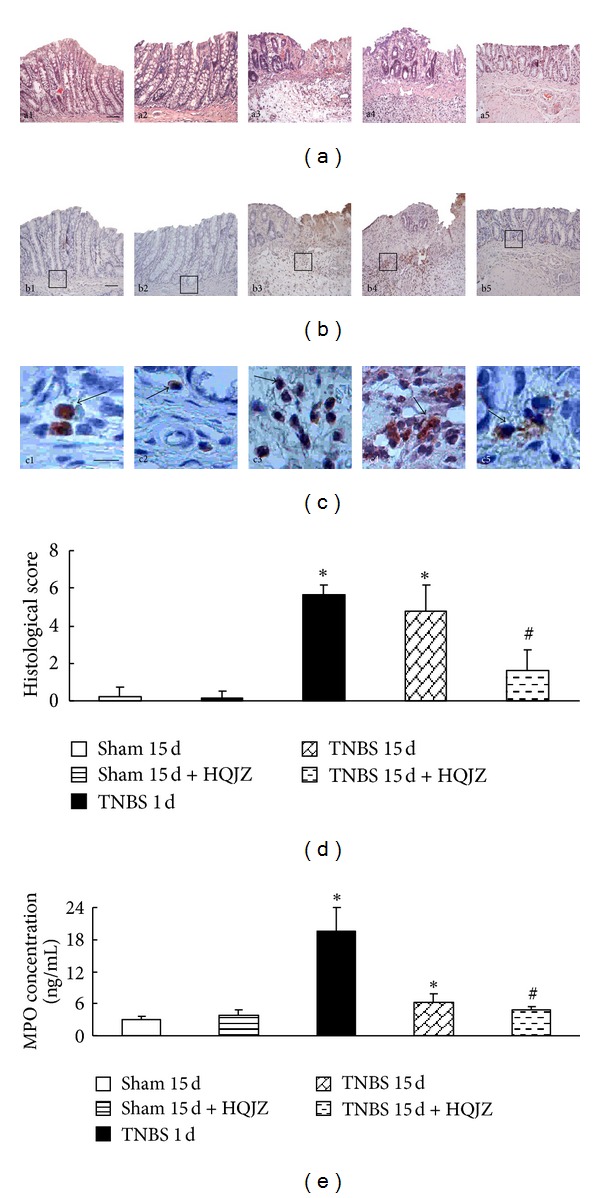
Representative histological images and scores and immunostaining and ELISA for MPO. (a) Representative histological images stained by HE, a1: Sham 15 d; a2: Sham 15 d + HQJZ; a3: TNBS 1 d; a4: TNBS 15 d; and a5: TNBS 15 d + HQJZ. Bar =100 μm. (b) and (c) Immunostaining for MPO, b1 and c1: Sham 15 d; b2 and c2: Sham 15 d + HQJZ; b3 and c3: TNBS 1 d; b4 and c4: TNBS 15 d; and b5 and c5: TNBS 15 d + HQJZ. The arrowheads indicate MPO-positive cells. Bar (b1) = 100 μm; Bar (c1) = 25 μm. (d) Histological scores. (e) The concentration of MPO determined by ELISA. Data were mean ± SEM (n = 8). *P < 0.05 versus Sham group; # P < 0.05 versus TNBS 15 d group.
