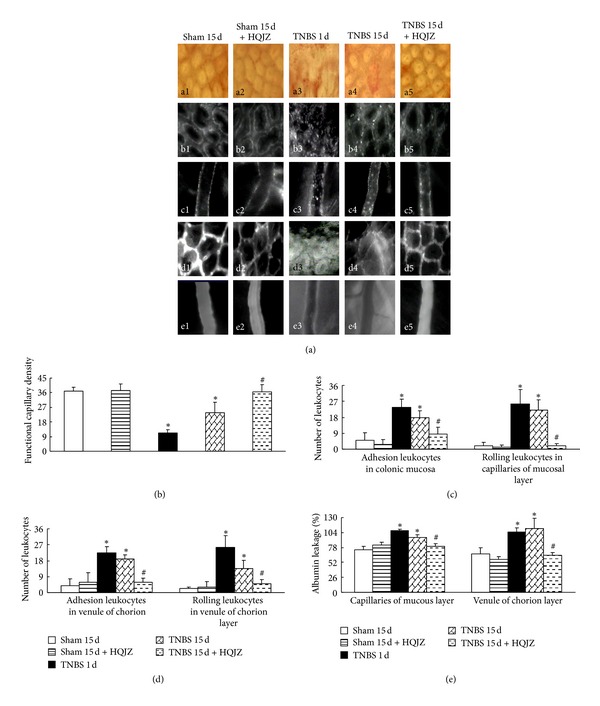
Figure 3.

Colonic microcirculation. (a) Representative images of colonic microcirculation in different groups. a1–a5: Representative distribution of capillaries in colonic mucosa from different groups. b1–b5: Leukocyte adhesion to venules in mucous layer. c1–c5: Representative images of leukocyte adhesion to the wall of venules in chorion layer. d1–d5: Albumin leakage from venules in mucous layer. e1–e5: Representative images of albumin leakage from venules in chorion layer. Bar = 50 μm. (b) The density of functional capillaries in different groups. (c) The number of rolling and adherent leukocytes in venules in mucous layer. (d) The number of rolling and adherent leukocytes in venules of chorion layer. (e) Statistic analysis of albumin leakage from venules in chorion and mucous layer. Data were mean ± SEM (n = 6). *P < 0.05 versus Sham group; # P < 0.05 versus TNBS 15 d group.
