Figure 5.

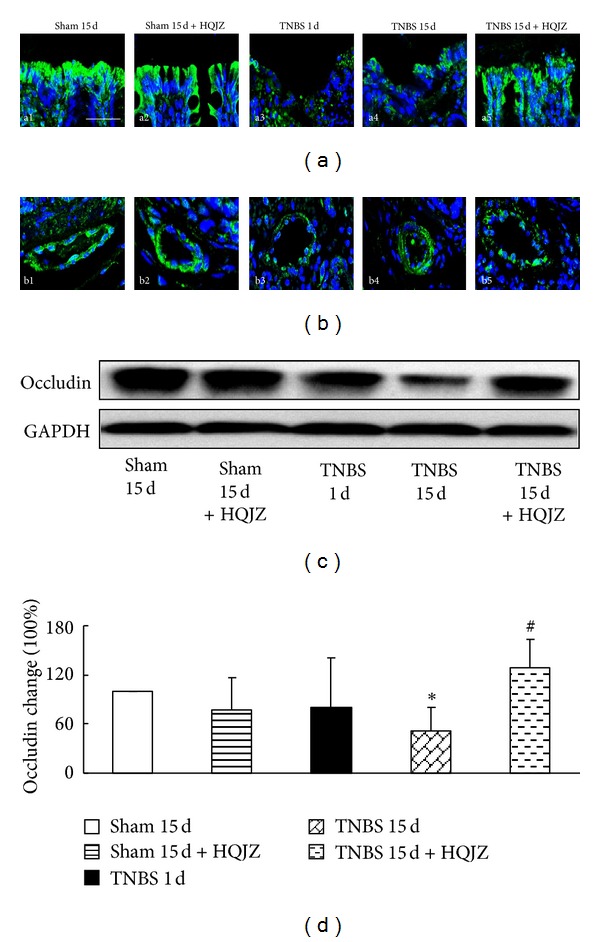
Representative immunofluorescence confocal images and Western blot analysis of occludin. Representative immunofluorescence confocal images of occludin in colonic mucosa (a) and venules from different groups (b). The green zone represents the distribution of occludin and the blue zone nuclei. Bar = 25 μm. (c) Representative Western blot of occludin protein. (d) Quantitative analysis of occludin protein in colonic mucosa from different groups. Data were mean ± SEM (n = 5). *P < 0.05 versus Sham group; # P < 0.05 versus TNBS 15 d group.
