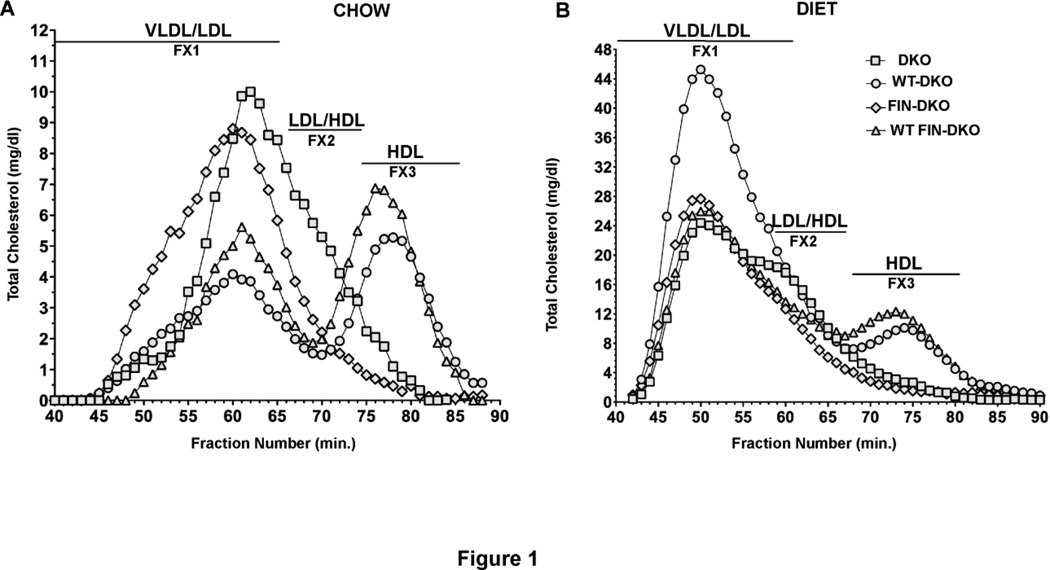
Figure 1. Lipoprotein Cholesterol Distribution After FPLC of Mouse Plasma.
Panel A shows the cholesterol distribution for chow-fed and Panel B shows the distribution for atherogenic diet-fed mouse plasma. After approximately 12 wks of chow or diet, whole mouse plasma was ultracentrifuged to obtain the d<1.225 total lipoprotein fraction, which was then separated into various lipoprotein classes by FPLC. Then the total cholesterol concentration in each fraction was measured by enzymatic assay and expressed as mg/dL of plasma. All techniques used here are described in “Materials and Methods”. Mouse genotype abbreviations are: LDLr−/−, apoA-I−/− = DKO; Transgenic human apoA-IWT, LDLr−/−, apoA-I−/− = WT-DKO; transgenic human apoA-IL159R, LDLr−/−, apoAI−/− = FIN-DKO; transgenic apoA-IWT and apoA-IL159R, LDLr−/−, apoA-I−/− = WT FIN-DKO. The profile for each genotype was obtained from an individual mouse’s plasma, however numerous profiles for each genotype were run to ensure reproducibility.

