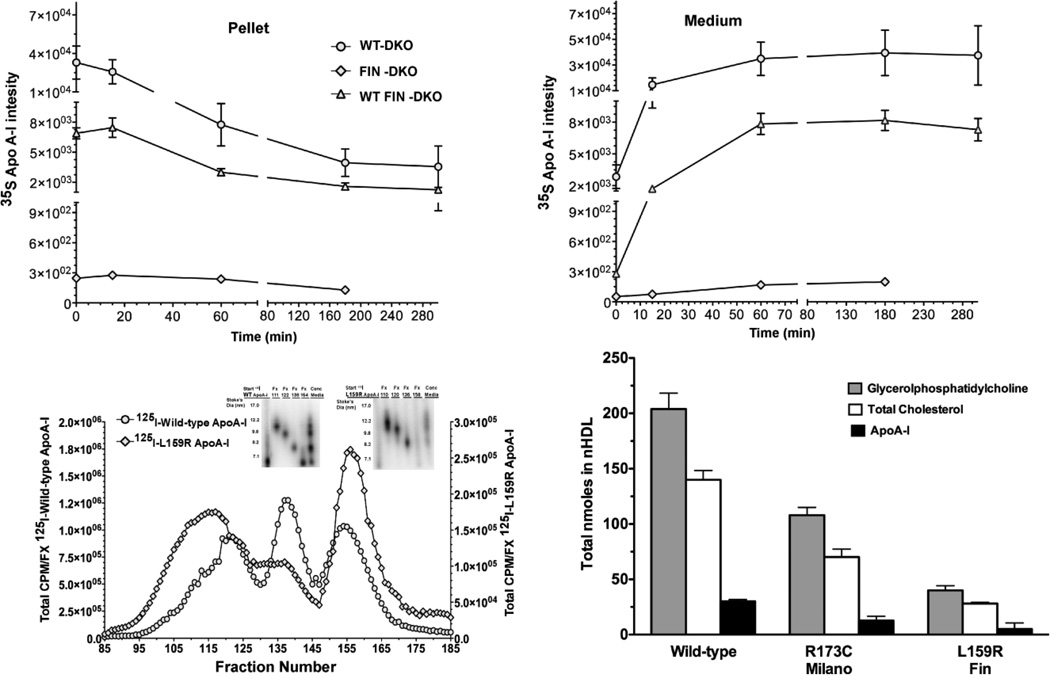
Figure 3. Expression of Wild-type and L159R ApoA-I.
Panel A and B shows the expression of newly synthesized apoA-I from primary mouse hepatocytes that were pulsed-chased with 35S-Met, immunoprecipitation and run on SDS PAGE. Newly synthesized apoA-I disappearance from the cell pellet Panel A, (circles) hepatocytes from WT-DKO mice ;(diamond) hepatocytes from FIN-DKO mice and (triangle) from WT FIN-DKO mice and appears in the culture medium Panel B. Data was obtained from imaging and plotted as 35S intensity, as described in “ Materials and Methods.” Panel C shows the size distribution of lipidated apoA-I (or nascent HDL) particles after incubation with ABCA1 expressing HEK cells incubated with 10 µg/ml of lipid-free human 125I-apoA-I in serum free media for 18 hrs. Following the incubation the medium was removed, concentrated and separated using FPLC. The radioactive content of each fraction was determined and plotted as the percent of total 125I-apoA-IWT (circles) and apoA-IL159R (diamonds) per fraction. Inset shows 4–30% nondenaturing gradient gel electrophoresis. Radioactive protein bands were visualized on the gel using phosphorimaging; Panel D, shows the total nmole of the two major classes of lipids. Compositional analysis indicated that the major lipids comprising nHDL particles were glycerophospholipid (GP) shown in shaded bars, and cholesterol shown in open bars. Total cholesterol was measured using GC/MS methodology while GP was analyzed using LC/MS/MS and cholesterol by GC/MS as described in “Materials and Methods.”. All values represent the mean ± S.D of 3 to 4 independent experiments. Mouse genotype abbreviations are the same as in Figure 1.

