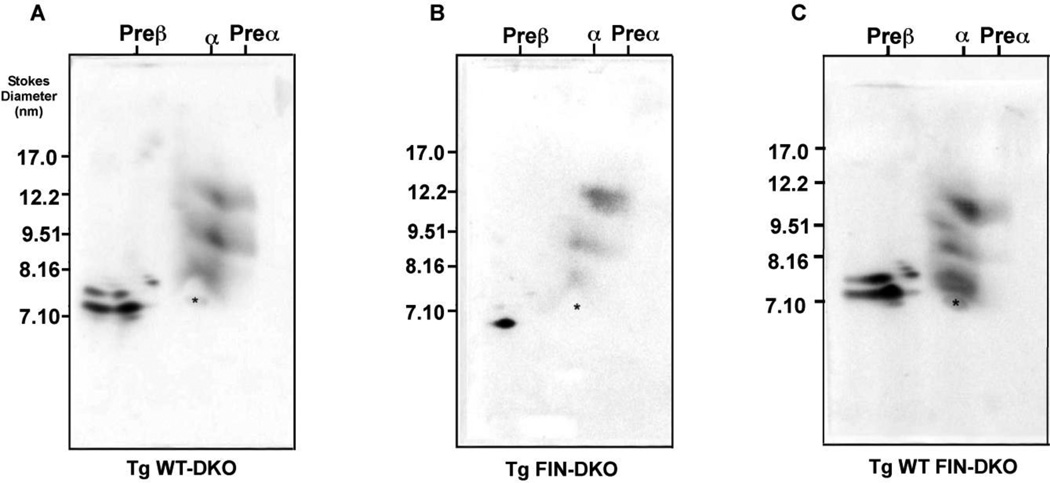
Figure 6. 2-Dimensional Electrophoresis of HDL from Chow- and Diet- fed Mouse Plasma.
The panels show HDL subclass distribution in plasma of: Panel A shows WT-DKO; Panel B shows FIN-DKO; and Panel C shows, WT FIN-DKO. Total mouse plasma was separated on 2-D gels as described in “Materials and Methods” and in the legend to Figure 1. The asterisk designates the mobility of endogenous serum albumin that marks the α-mobility front. Mouse genotype abbreviations are the same as in Figure 1.

