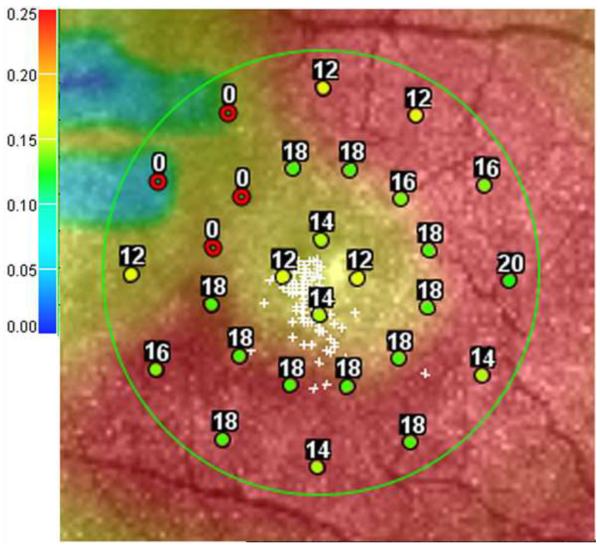
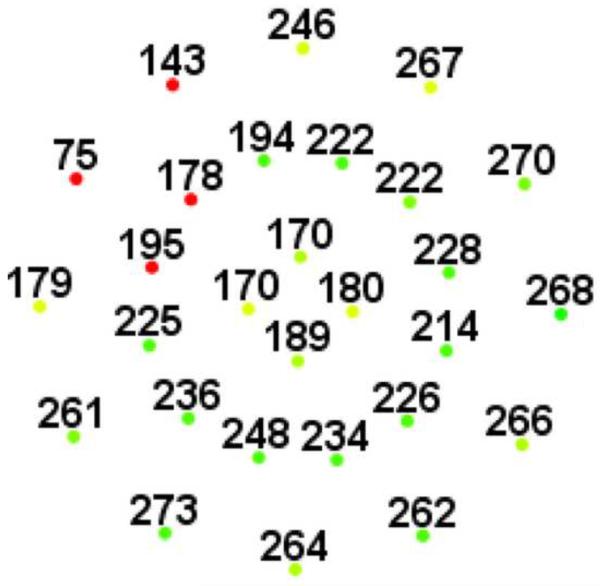
Figure 2.

Microperimetry and SD-OCT data of right eye of patient 3 with SS sickle cell disease and macular focal thinning (Group A, BCVA 20/25). (Top Left) Microperimetry Polar 3 test grid superimposed on the SLO infrared image. Small white crosses indicate fixation. Each value represents the light sensitivity for the corresponding retinal area. Based on normative data for this particular instrument, a sensitivity of > 12 dB was considered normal. Note markedly reduced retinal sensitivities temporally (4 data points of 0 dB temporally). (Top Right) Corresponding SD-OCT thickness (μm) at each of the 28 Polar 3 tested points showing thinning temporally. (Bottom) SD-OCT B-scan image showing focal macular thinning temporally seen as abrupt asymmetric decrease in retinal thickness as indicated by arrow.


