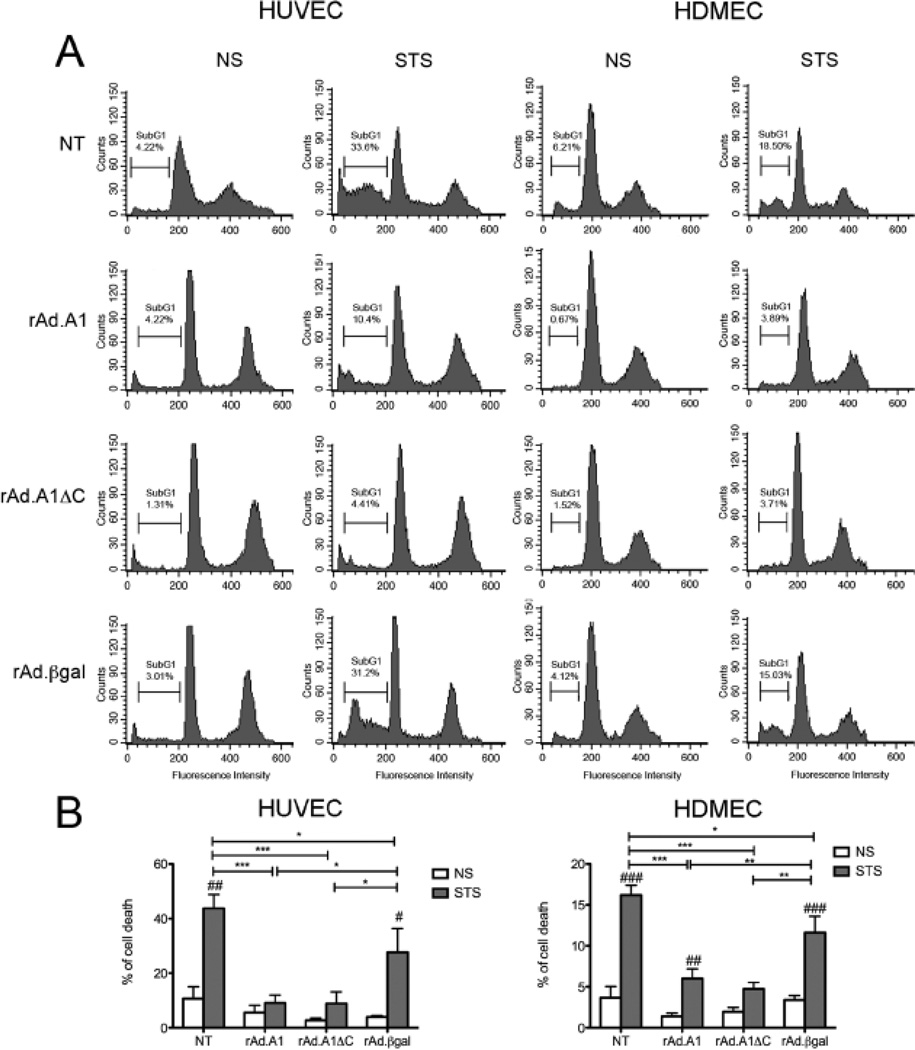
Fig. 5.
Full-length A1 and A1ΔC mutant protect HUVEC and HDMEC from cell death induced by staurosporine (STS). Non-transduced (NT), rAd.A1, rAd.A1ΔC, and rAd.βgaltransduced (A) HUVEC and HDMEC were treated with STS (100 nM) for 6 h, then labeled with propidium iodide. Apoptosis was evaluated by FACS analysis of DNA content. Data shown are representative of 3 independent experiments. The percentage of cells undergoing cell death, as evidenced by DNA<2N (subG1 phase) is reported. (B) Bar chart representation of mean percentage of cell death ± SEM of the 3 experiments performed. *p<0.05, **p<0.01, ***p<0.001 indicate significance among different treatment groups, i.e. non tranduced (NT) EC and EC transduced with different rAd. #p<0.05, ##p<0.01, ###p<0.001 indicate significance between non stimulated (NS) and STS-treated HUVEC and HDMEC within the same experimental group.

