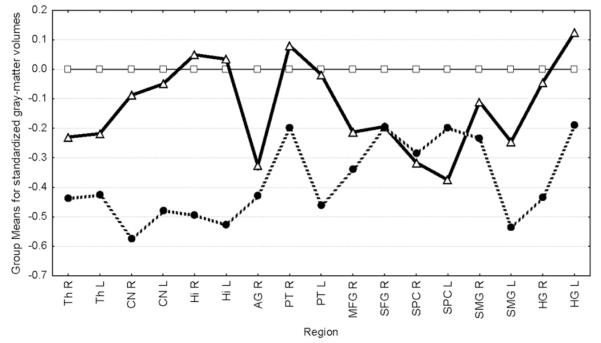
Fig. 2.

Group means for standardized grey-matter volumes. Grey-matter volumes for each region were standardized to the control mean. Mean standardized scores for HC-C (dashed line), HC + C (thick line) and controls are plotted on the Y-axis for each region mentioned on the X-axis. HR−C are seen to show deficits for most regions compared to both HC and HR+ C. HR+ C appear to be intermediate between HC and HR−C for volumes. Th=Thalamus, CN=caudate nuclei, AG=angular gyrus, SMG=supramarginal gyrus, PT=pars triangularis of the inferior frontal gyrus, HI=hippocampus, MFG=middle frontal gyrus, SFG=superior frontal gyrus, HG =Heschl’s gyrus. All regions were reduced in HR−C compared to controls.
