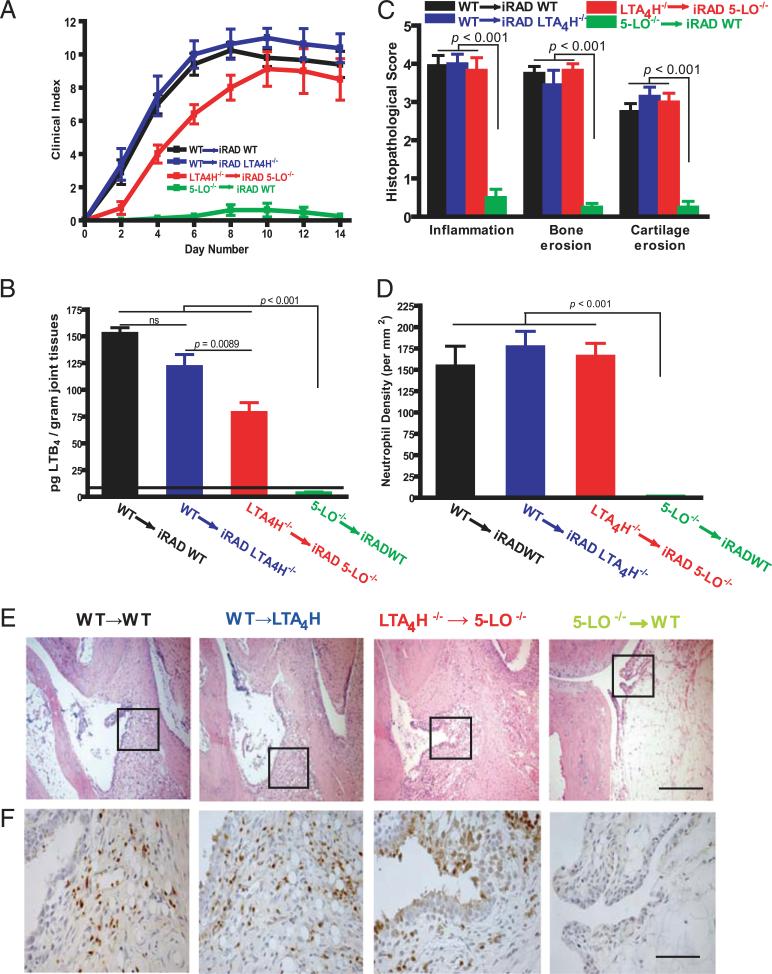
FIGURE 1.
Transcellular biosynthesis of LTB4 in K/BxN serum-induced arthritis. A, Clinical index of arthritis severity was monitored daily after arthritogenic K/BxN serum administration to irradiated mice reconstituted with BM from various genotypes. Symbols refer to the donors and to the recipients, respectively (donor genotype → iRAD recipient genotype). Values are the mean ± SEM of data pooled from three independent experiments. (n = 15 mice per group). Differences were significant at p < 0.001 for WT → iRAD WT, WT → iRAD LTA4H–/–, and LTA4H–/– → iRAD 5-LO–/– versus 5-LO–/– → iRAD WT ; p = NS for WT → iRAD WT and WT → iRAD LTA4H–/– versus LTA4H–/– → iRAD 5-LO–/–. B, Quantification of LTB4 production in arthritic joint tissues. Ankle tissues from recipient mice reconstituted with BM from specified genotypes were homogenized, and lipids were extracted at 14 d after K/BxN serum administration. Lipid extracts then were fractionated via RP-HPLC, and fractions corresponding to the retention time for LTB4 were analyzed by ELISA as described in Materials and Methods. Values depicted are picograms per gram of joint tissue (mean ± SEM) of data pooled from three independent experiments. C, Histomorphometric arthritis quantification. Shown are quantitative measurements (mean ± SEM) of inflammation, bone erosion, and cartilage erosion in ankles from each irradiated recipient mice at 14 d after serum administration. Values are the mean ± SEM of data pooled from three independent experiments (n = 15 mice per group). D, Neutrophil enumeration in arthritic synovial tissue. Tissues from experimental mice in Awere stained with anti-Ly6G mAb NIMP-R14, and neutrophil density was quantified histomorphometrically. The data are the mean ± SEM of three independent experiments. The p values in B, C, and D, compared with those detected in 5-LO–/– → iRAD WT, are indicated on the top of each bar. E, Representative histological sections of ankle tissues from mice examined in A. Scale bar, 100 μm. F, Immunohistochemical staining for NIMP R14+ neutrophils quantified in D. Scale bar, 25 μm.

