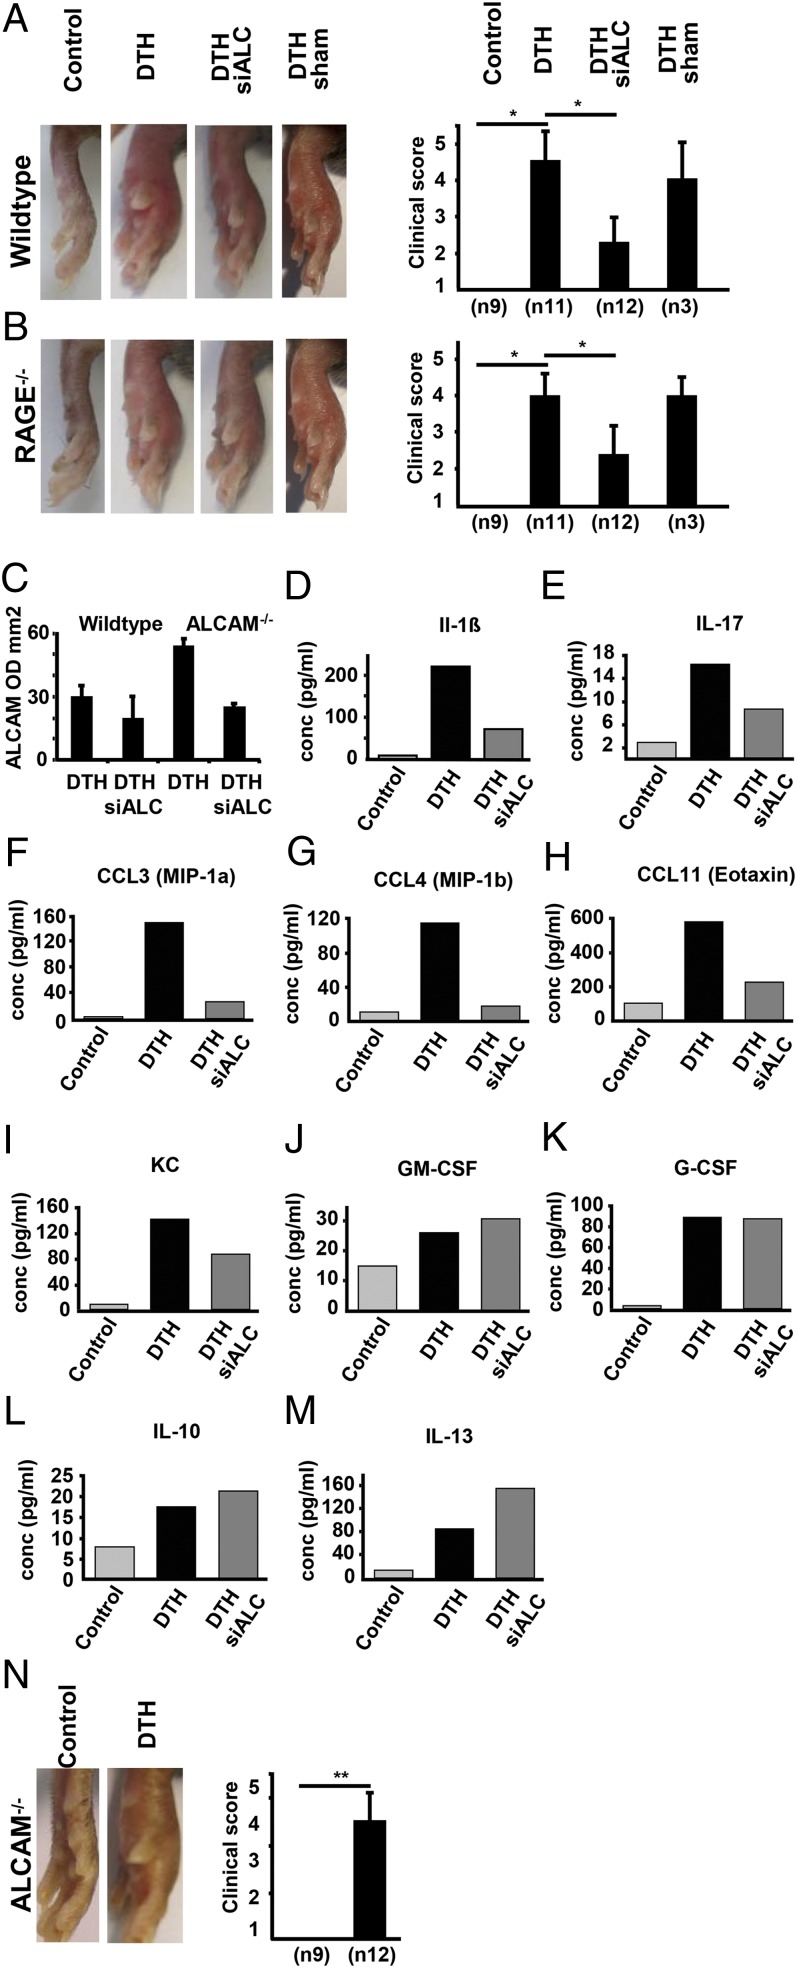
FIGURE 4.
DTH clinical score and cytokine expression in WT and RAGE−/− mice with and without prior siRNA ALCAM and DTH in ALCAM−/− mice. Time point is 24 h after DTH induction. (A) Representative pictures of DTH in left footpads of WT mice, compared with control, siALCAM-treated, and sham-transfected animals. Data of clinical inflammation scores are the mean ± SE from three independent experiments, with a total number of animals per group as indicated (n). *p < 0.01. (B) DTH in RAGE−/− mice with and without prior treatment with siRNA ALCAM or sham transfection. Data for clinical inflammation score are the mean ± SE from three independent experiments with a total number of animals per group as indicated (n). *p < 0.01. (C) Densitometry of ALCAM PCR from footpads of WT and RAGE−/− mice, with and without prior ALCAM siRNA transfection; n = 2 animals per group. (D–M) Expression of inflammation-related cytokines determined by Plex analysis of footpad lysate 24 h after DTH induction in WT mice. Footpad material was processed for Plex analysis as described in Materials and Methods. (D–I) Expression of proinflammatory cytokines is augmented in DTH footpads of WT mice treated with siRNA ALCAM before induction of inflammation. (J and K) Expression of GM-CSF and G-CSF is not changed. (L and M) IL-10 and IL-13 expression is elevated. Results of multiplex analysis from one experiment. (N) Control and DTH in ALCAM−/− mice. Data for clinical inflammation score are the mean ± SE from three independent experiments, with a total number of animals per group as indicated (n). **p < 0.001.

