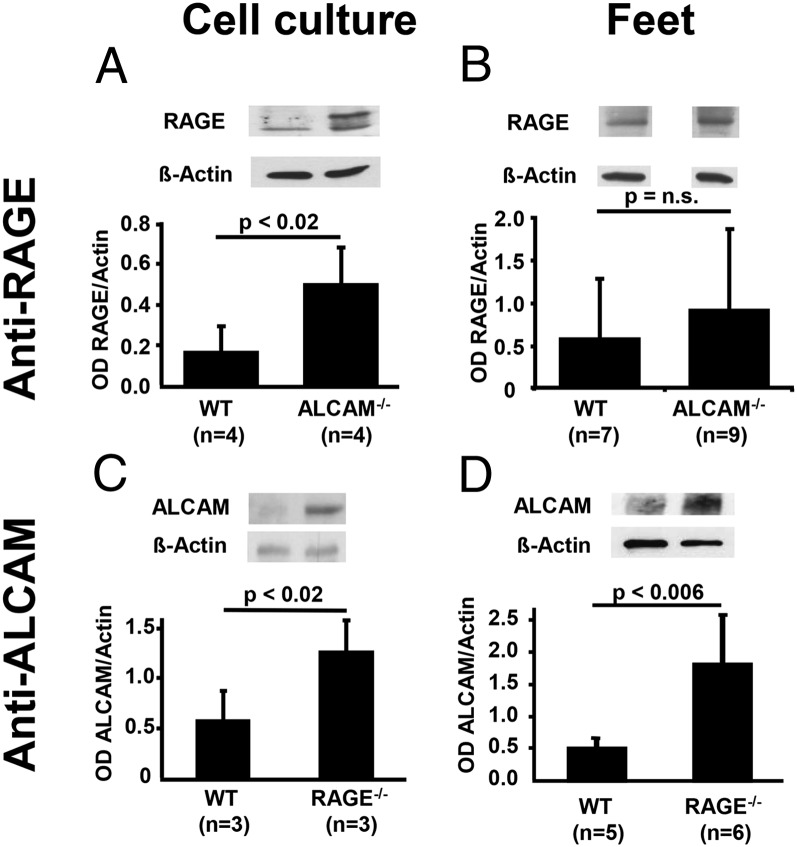
FIGURE 5.
Compensatory upregulation of RAGE in ALCAM−/− and of ALCAM in RAGE−/− mice. (A) Western blot using anti-RAGE in WT and ALCAM−/− MAECs. (B) Western blot using anti-RAGE in WT and ALCAM−/− feet. (C) Western blot using anti-ALCAM in WT and RAGE−/− MAECs. (D) Western blot using anti-ALCAM in WT and RAGE−/− feet. The bar graphs show densitometry normalized to actin, number of different cell populations, or feet from separate animals as indicated. Data are the mean percentage ± SE. p < 0.05 was considered statistically significant.

