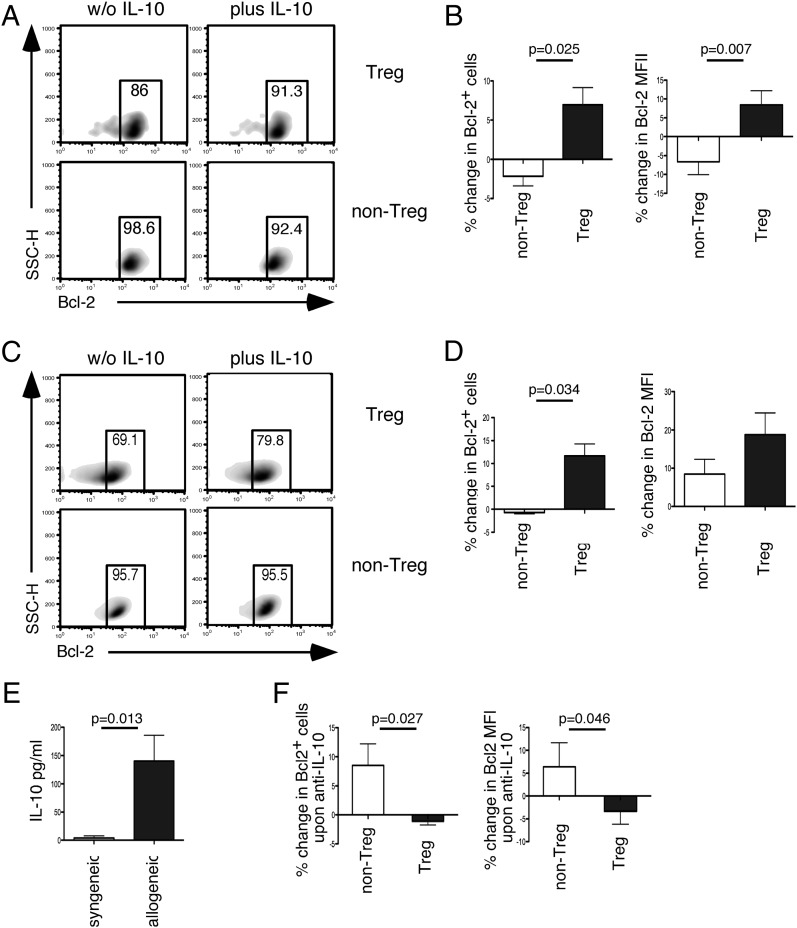
FIGURE 6.
Differential effects of IL-10 on Bcl-2 expression in Treg and non-Treg cells in vitro. (A) Representative density plots showing expression of Bcl-2 in the presence or absence of 200 IU/ml IL-10 cocultured human non-CFSE labeled CD4+ CD127loCD25+ Treg and CFSE-labeled CD4+CD127hiCD25− non-Treg cells. Cells were stimulated with CD3/CD28 Abs and analyzed on day 3. (B) Summary bar graph (mean ± SEM) showing percentage of change in Bcl-2+ cells as well as percentage change in Bcl-2 MFI levels within these two subsets. Data are shown from seven independent experiments. (C) Representative flow cytometry staining showing expression of Bcl-2 in cocultured CD4+GFP+ Treg cells and CD4+GFP− non-Treg cells isolated from splenocytes of DEREG BALB/c mice with and without 400 IU/ml IL-10 plus anti-CD3/CD28. (D) Summary bar graphs (mean ± SEM) showing percentage of change in Bcl-2+ cells and percentage of change in Bcl-2 MFI levels. Data are shown from 3 independent experiments. (E) Summary bar graph (mean ± SEM) showing IL-10 level (pg/ml) in supernatant from splenocytes from female CBA/J mice stimulated with irradiated slenocytes from syngeneic CBA/J males or allogeneic BALB/c males. Data show eight and nine animals, respectively, in each group. (F) Summary bar graph (mean ± SEM) showing percentage of change in Bcl-2+ cells upon anti–IL-10 treatment as well as Bcl-2 MFI’s in cells from female CBA/J mice, stimulated with irradiated allogeneic male BALB/c lymphocytes. Data show 11 animals in each group.

