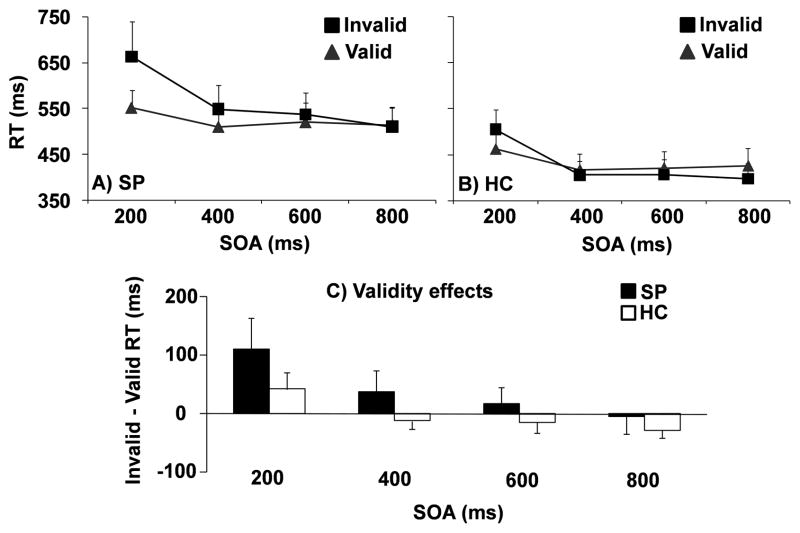
Figure 1.
Mean reaction time (RT) in milliseconds (ms) at each stimulus onset asynchrony (SOA) for patients (SP; Panel A) and controls (HC; Panel B). Grey triangles were used to represent valid trials and black squares for invalid trials. Panel C exhibits validity effects (invalid RT – valid RT) at each SOA for patients (SP; black) and controls (HC; white). Error bars correspond to two times the standard error of the mean for all data.

