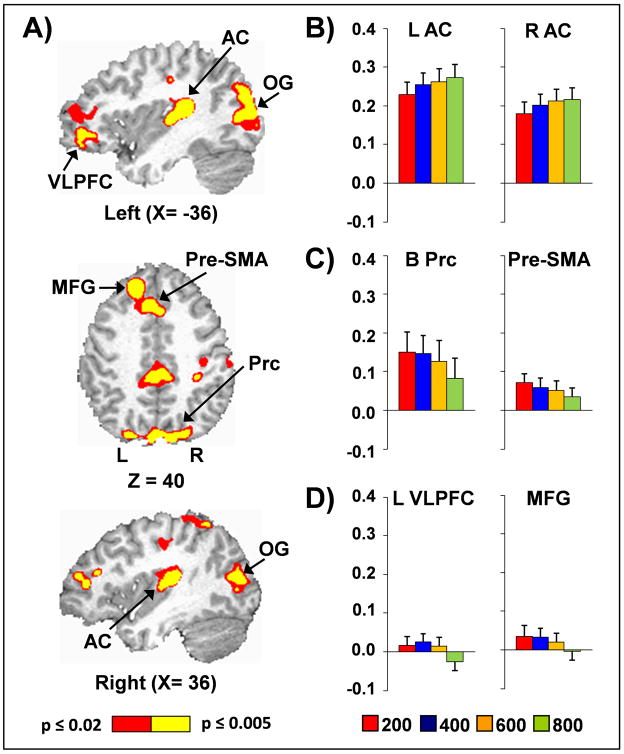
Figure 3.
Panel A presents regions exhibiting a main effect of stimulus onset asynchrony (SOA), with slice locations (X and Z) presented according to the Talairach atlas. Panels B-D present the percent signal change (PSC) data from selected regions at the 200 (red), 400 (blue), 600 (orange) and 800 (green) ms SOA intervals. In Panel B, the main effect of SOA was associated with increasing activation as a function of SOA in the bilateral primary and secondary auditory cortex (AC). Panel C shows how activation within the bilateral precuneus (B Prc) and pre-supplementary motor area (Pre-SMA) decreased as a function of SOA. Finally, activation within the bilateral middle frontal gyrus (MFG), bilateral occipital gyri (OG; percent signal change data not presented) and left ventrolateral prefrontal cortex (L VLPFC) decreased as a function of SOA, with deactivation present at longer SOAs (Panel D).

