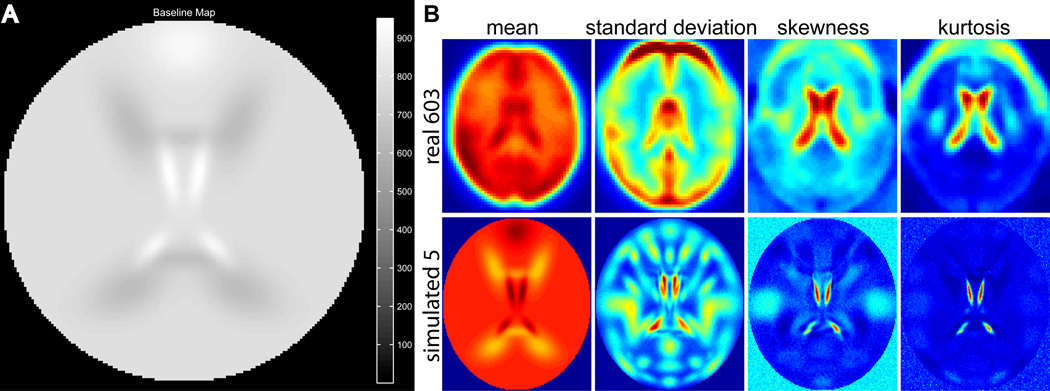
Figure 5.
(A) Tissue type map used for simulation. Note, compared to the default (Fig. 2B), WM is 0.8 (up from 0.7), CSF is 1.2 (down from 1.5), and frontal is 1.15 (up from 0.3). (B) First four statistical moments in real data averaged over 603 healthy normal controls over T = 148 time points (Allen et al., 2011b), as well as simulated data for 5 subjects with T = 150 time points. Except for real-data edge effects from warping and movement, the first four central statistical moments (mean, variance, skewness, and kurtosis) can be closely matched with simulated data.

