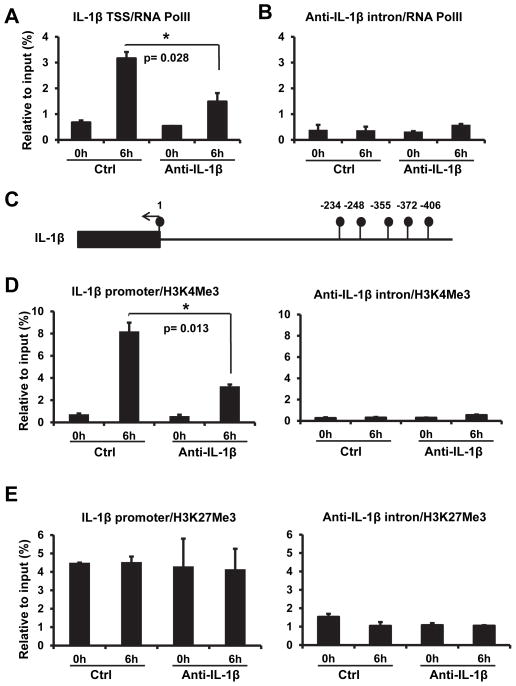
Figure 7. Anti-IL-1β leads to modification IL-1 β chromatin structure.
(A) Over-expression of anti-IL-1β decreased recruitment of RNA polymerase II to the IL-1β transcription start region. Genomic DNA was pulled down by anti-RNA polymerase II antibody and quantitated by real-time qPCR with the primers specific to the IL-1β transcription start region. The amount of DNA determined by qPCR is plotted. (B) Anti-IL-1β has no effect on the binding of RNA polymerase II to the anti-IL-1β intronic region. Samples were collected as in (A) and quantitated by qPCR with anti-IL-1β intron specific primers. All values were represented as mean±SEM from triplicated samples (n=3). (C) Schematic of IL-1β promoter region. Filled circles represent CpG sites and the filled box represents the start of the IL-1β mRNA. Anti-IL-1β overexpression did not lead to CpG methylation change at these sites. (D) Anti-IL-1β reduced H3K4Me3 bound to the IL-1β promoter. Genomic DNA, pulled down with anti-H3K4Me3 antibody from control and anti-IL-1β overexpression cell lines, were analysed by real-time PCR analysis to quantitate the IL-1β promoter (-1 to -150) and intronic DNA. (E) H3K27Me3 levels were not affected by anti-IL-1β overexpression. Genomic DNA was pull down as in (D) with H3K27Me3 antibody. All values were represented as mean±SEM from triplicated samples (n=3). One representative experiment out of three is shown. The symbol * marks a significantly different result (p<0.05) compared to respective control value.

