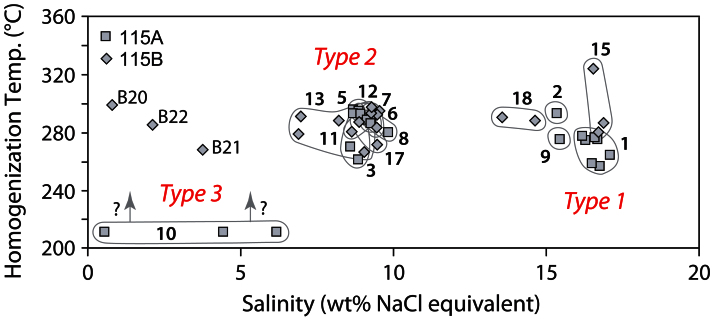
Figure 2. Homogenization temperatures of fluid inclusions plotted as a function of fluid salinity.
Three fluid salinity groups (types 1, 2 and 3) are clearly defined. Individual fluid inclusion assemblages are numbered. Results from two samples, 115A and 115B, reproduce the same pattern providing confidence in the observed trends. Three type 3 inclusions did not have homogenization temperature measurements; these are plotted along the bottom axis.

