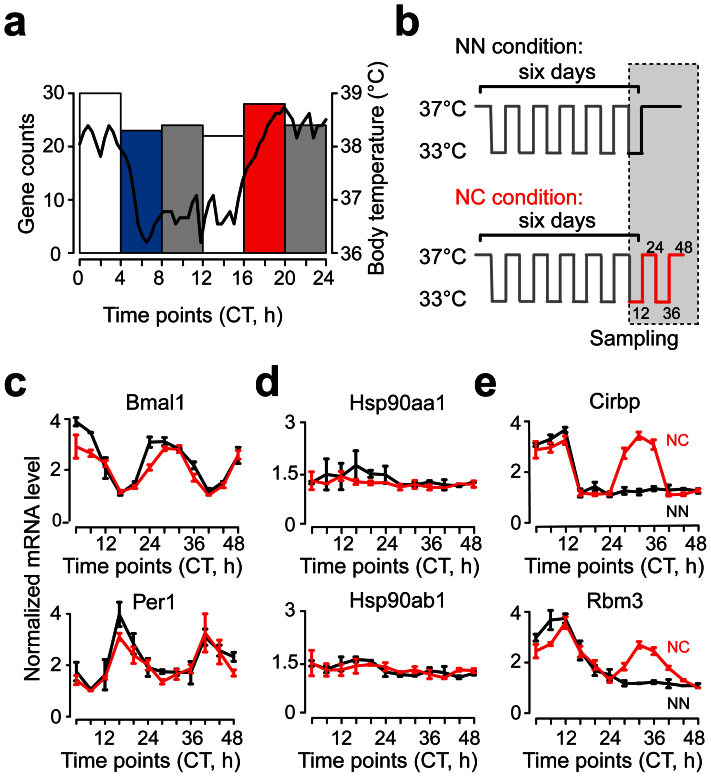
Figure 1. RBPs are potential regulators in the temperature entrainment of circadian clock.
(a) Histogram of the circadian peak times of 151 circadian oscillating genes. Black curve represented the mouse daily body temperature52. The groups of the genes with significantly enriched GO categories were highlighted. CT, circadian time in hour (h). (b) The schematic diagram of the square wave temperature synchronization model. Sampling time was indicated. (c–e) The expression patterns of the core circadian genes and the genes of HSPs and RBPs in the temperature synchronization model. The lowest expression value was normalized to 1 (black, NN condition; red, NC condition). Data are represented as mean +/− SEM (n = 3).

