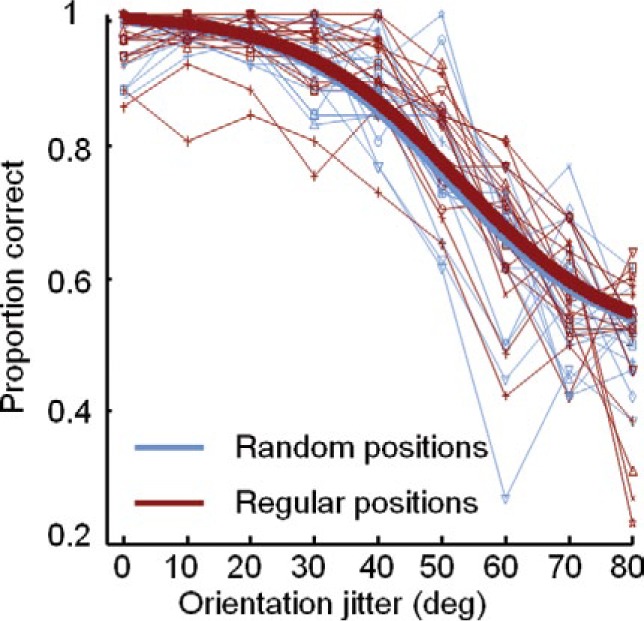
Figure 4.

Individual data and model predictions for performance in the discrimination task (Experiment 1). Thin lines show the performance on an individual level (each symbol represents one subject). The thick lines are the model predictions on a group level. The predicted curves for regular and random positioned elements are very similar (almost no difference between the thick red and blue lines, respectively).
