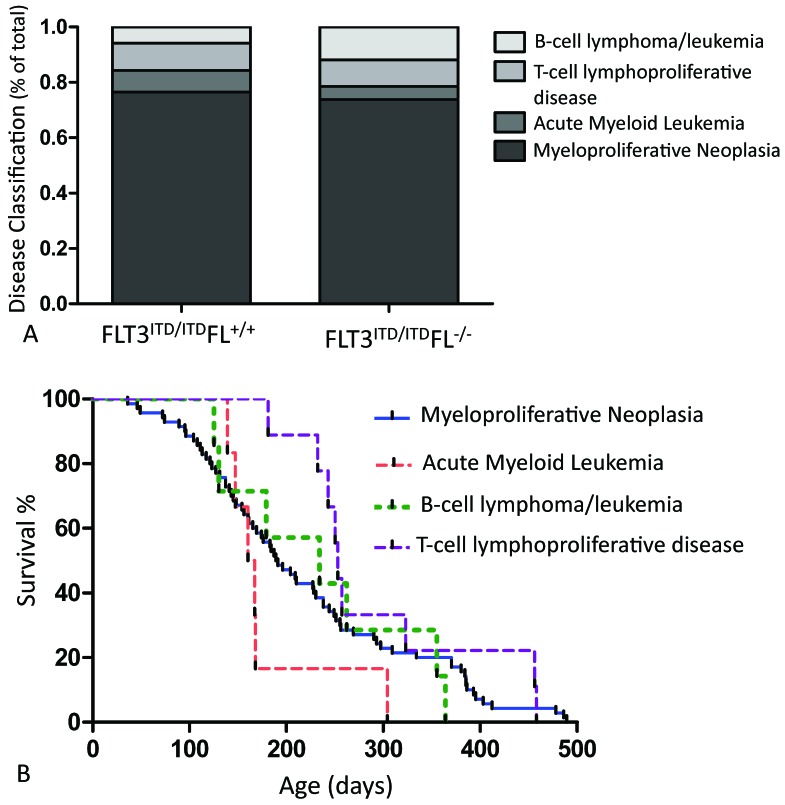
Figure 3.
(A) Disease classification of FLT3ITD/ITD FL+/+ (n = 55) and FLT3ITD/ITD FL−/− (n = 44) mice expressed as a percentage of total. (B) Pooled outcome of FLT3ITD/ITD mice. Disease outcome is plotted in relationship to time to disease. There is a steady incidence of MPN; after a brief lag, cases of AML tended to occur early compared with those of B- and T-cell disease.

